
Hey everyone! We have been cookin’ up some amazing stuff, and have something really special to share today.
📈 All-new chart cell
Our old chart cell was… good? It was fine. Better than writing a dozen lines of matplotlib. But we all know it could be so much better.
We heard you, loud and clear, and we have been working hard on a complete, ground-up re-write, and we’re so excited to share the final product.
This new cell makes it easier to configure charts of all kinds, including better support for things like histograms, multi-series legends, and tooltips. It’s really an entirely-new experience, and we hope you love using it as much as we have during our testing.
Check out the Blog for more info (but really, you should just jump right into Hex and try it out)
⬇️ Visual filtering
This new foundation has allowed us to build something really fun – interactive visual filtering!
With visual filtering enabled, charts return dataframes representing the current selection, just like our no-code Filter cells. This turns charts into a tool for interactive, visual data exploration: you can display the resulting records in a table, or further slice-and-dice them in another visualization.
Visual filtering is also available in published apps, allowing end-users to directly interact with reports, dashboards, or tools you publish in Hex. This can completely replace complex, tedious workflows with multiple input parameters and filter steps. Just point, click, and go.
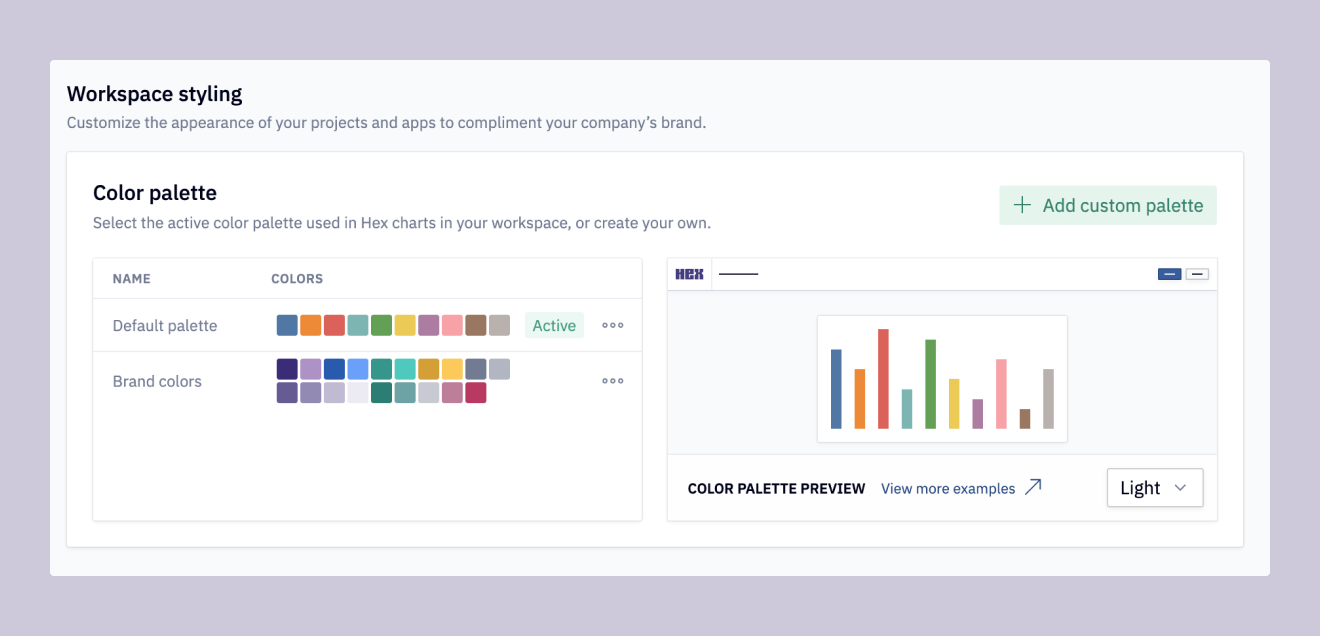
🎨 Custom color palettes
Our most-frequently requested feature for charts (besides, well, making them better) – you can now configure brand-specific colors and use them across all charts in your organization.
You can configure these in the admin panel, adding up to 20 colors, and specify which palette to use as default. Updating the palette will change the colors on existing charts, so you don’t have to go manually update each one!
Other improvements
- When you start typing a comment but click away, we now store your unfinished thought in the comment for you to return to later.
- In the same spirit, we also removed the requirement to hit “Save” when configuring an input cell — clicking out of the UI also saves your settings.
- CSVs now have a useful filename when you download them, concatenating the cell name with the current timestamp. Be gone,
export (12).csv! - We fixed a bug where Redshift clusters with multiple databases insisted on showing just the one database. As a result, datashares also show up in the schema browser. While we were at it, we also made Redshift external tables appear as well.
- PS: Pivot and Filter cells now work with query results. Watch this space for more news ;).