Hex projects now have a fully reactive, DAG-based recompute model, which only re-executes cells as required based on upstream changes.
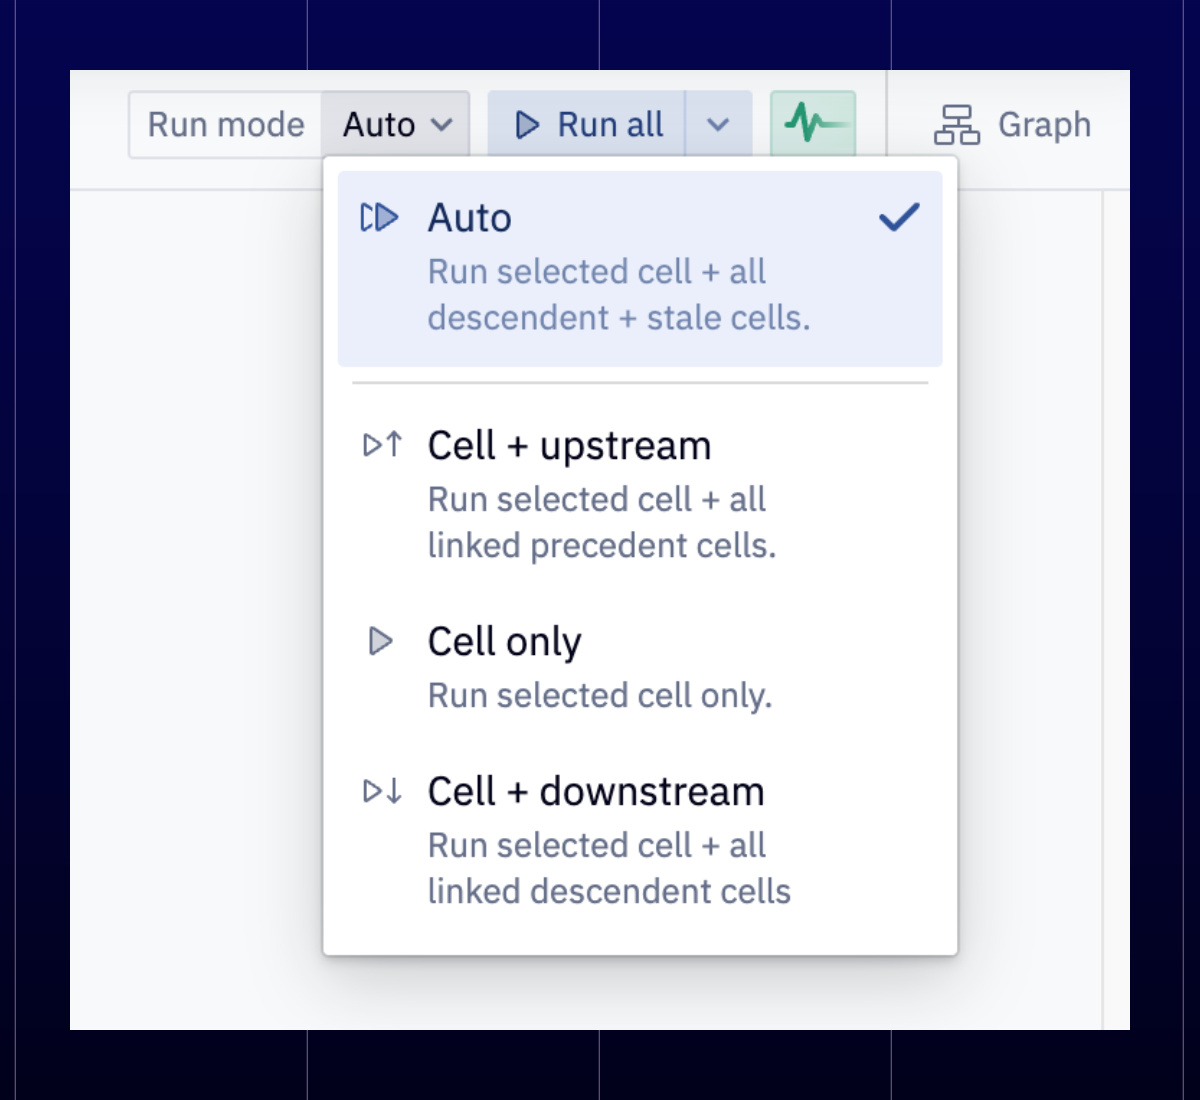
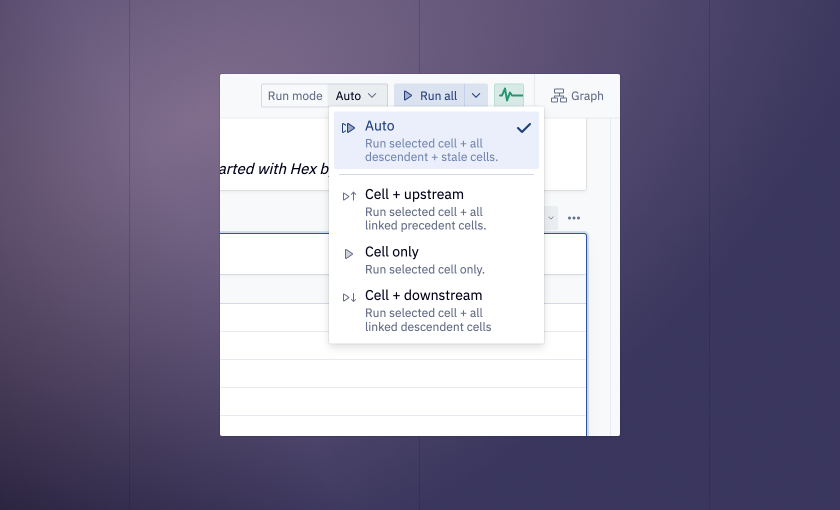
To enable this, all you have to do is set your Run Mode to Auto. Now whenever you update a parameter or a cell, Hex will analyze the code and re-run other cells as needed. If you ever want to go back to one-cell-at-a-time, you can easily toggle to Cell Only from the top bar.
Auto Run is a massive improvement for reproducibility, interpretability, and performance, both in Notebook and App views.
🕸️ The Graph
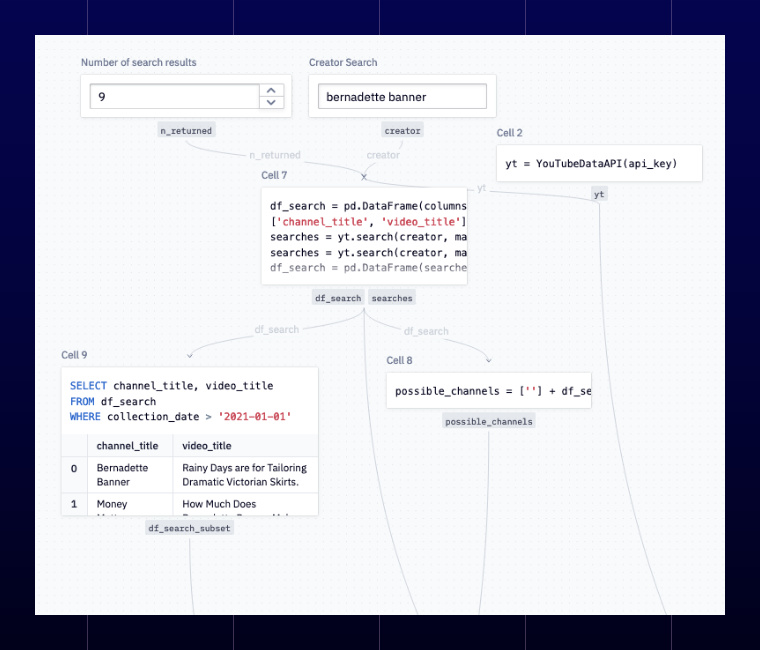
Hit the Graph button in the upper right to open an interactive DAG visualization of your project. All cells with variable relationships are automatically displayed, with their dependencies easily charted:
This lets you rapidly understand even a very complex project, visually exploring the flow of data and variables in a way that simply isn't possible from a typical notebook view.
Visualization options can be found in the 👁️ icon in the upper right.
👋 $o long to $, Hello New UI ✨
With the magic of Auto Run, we have also eliminated the $. Hex input parameters now return plain variable names e.g., input_1.
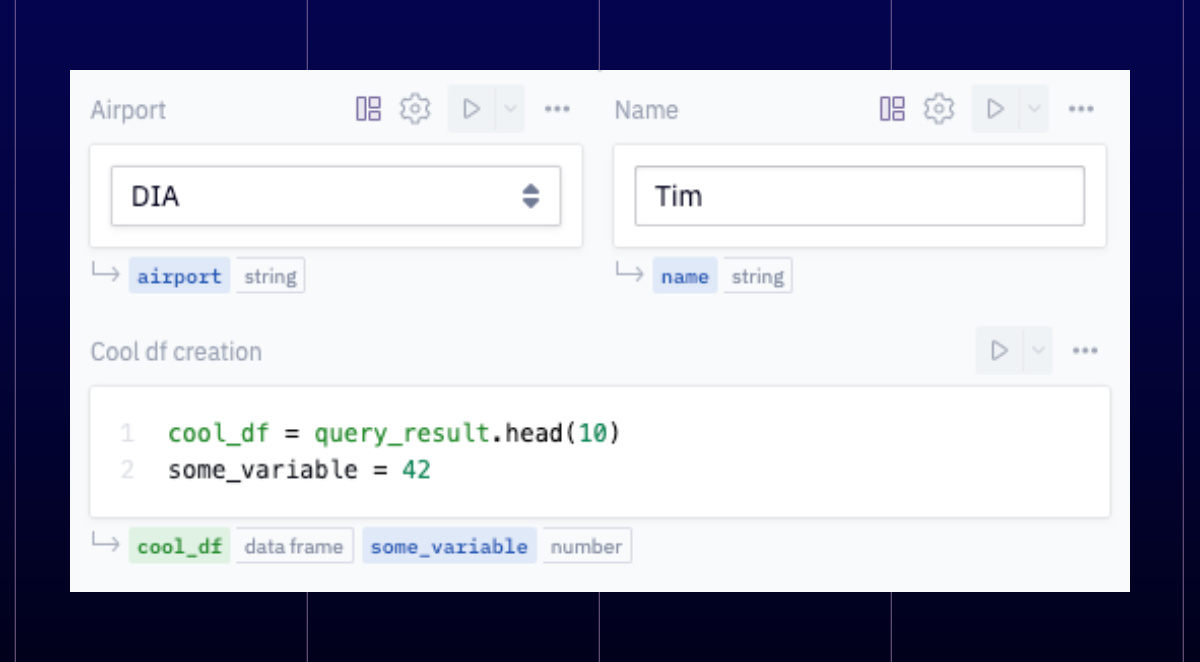
You can also see the variables returned by any cell in the new UI:
We've also refreshed the Notebook view UI to make it easier to understand what variables are being returned by each cell.
You can also hover on any returned variable to see metadata about it and discover where it's referenced in the project. This works really nicely with the graph!