Bumper Crop
[ buhm-per krop ]
noun: an unusually abundant harvest from a particular crop. The term is now most commonly used in a figurative way to refer to a large amount or influx of something (that’s often likened to a harvest).
// Thanks to ideal growing conditions, California had a bumper crop of olives in 2012.
// The stars aligned and Hex had a bumper crop of new features in August 2022.
Put down the Old Farmer’s Almanac and fire up your Hex workspaces, my data agronomists. The corn is tall, the sun is shining, and we’ve got an unusually bountiful harvest of new Hex features for you: App URL parameters, Schema Browser querying shortcuts, a new map region layer, Clickhouse support, new cell styles, chart cell updates, Library UI improvements, and more.
(Still feeling agricultural? Check out this quick Hex app that lets you explore historical crop yields. Spot any good bumper crops?)
🔗 App URL parameters
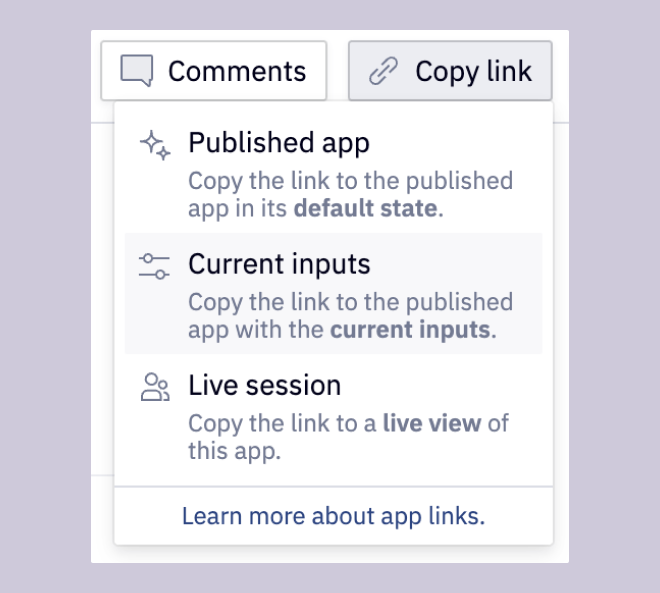
You can now generate a “Current inputs” sharing link that contains pre-filled values for input parameters, so you can share a specific view of an app.
These links actually include the input parameter values in-line, so you could generate them dynamically with code (say, to link from a recent sales app to a pre-filled view of a customer 360 app): https://app.hex.tech/hex-public/app/cc3f7ed7-e662-4d42-b36c-fa2fb8ec2740/latest?_area="United+States+of+America"&_crop="Olives"&_show_all_areas=false.
Though it’s possible to edit them manually, proper URL encoding can sometimes be hard to get right. The tried-and-true way to generate a properly formatted input link is to set the desired input values in a published app and use the “Copy link > Current inputs” button.
🔎 Schema Browser query shortcuts
There’s a handy new context menu on tables in the Schema Browser that lets you easily copy fully qualified table names or a pre-filled select statement that includes all columns.
Why do this instead of a shorter select *? Well, as you inevitably start narrowing the list of columns to return, going back and writing them out by hand becomes a lot more tedious than just deleting unwanted lines in a pre-written query.
We’re working on more updates to the Schema Browser, so reach out with any feedback on what functionality you’d like to see added!
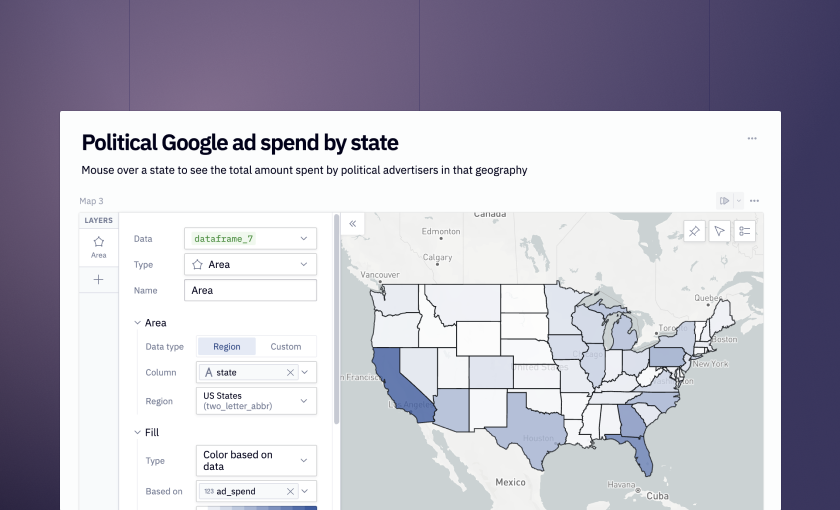
📍 Map area regions
Maps have some powerful new functionality: In an Area layer, you can now map data from common regions (countries, US states, counties, etc.) without having to provide complex geospatially formatted data. Just bring a column containing simple values (eg: California, Vermont, Arizona) and let the map layer handle the hard part.
We’re adding more map regions— if you have a region you frequently work with that isn’t in the list, shoot us a message and we’ll add it for you!
👨🎨 New cell styles
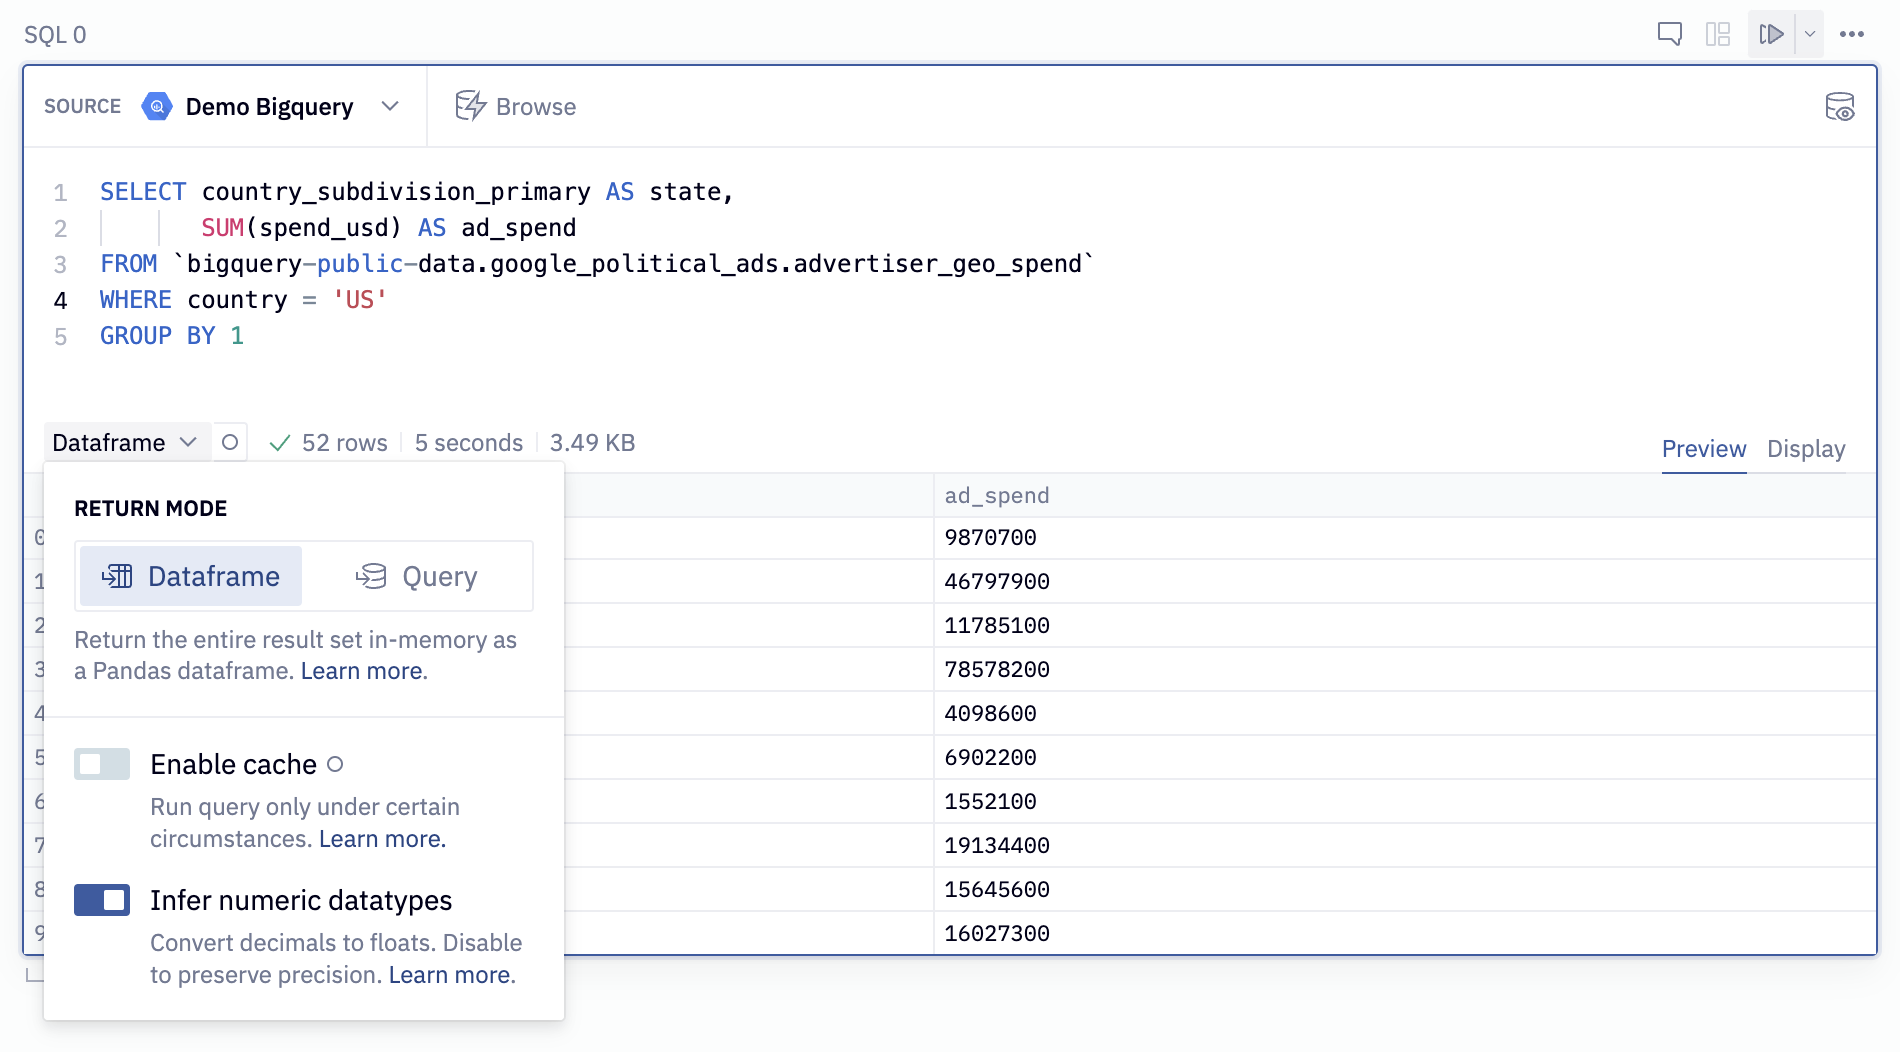
SQL and Text cells have a brand new coat of paint!
SQL cells have a streamlined UI that makes it easier to set cache options and simplifies switching between Dataframe and Query mode.
Text cells now blend in with the liminal space between cells in Notebook view, making them more visible as section headings and better differentiating between code and text.
Oh, and while we’re talking about Text cells…
📸 Images in Text cells
Text cells can now display images! Just drag an image inline, or copy and paste one in. This will add the image to the file directory of the project.
PS: This also works in markdown cells! Historically, local images from the project filesystem could not be referenced in Markdown cells, but this is now possible. You can also drag+drop or copy/paste new images into Markdown cells, just like Text cells.
📊 Charts updates
There’s a bunch of great updates to chart cells that have shipped out recently:
Layer legends
Multi-layer charts now show all series accurately in the legend! To enable this, select “Automatic” from the color picker config.
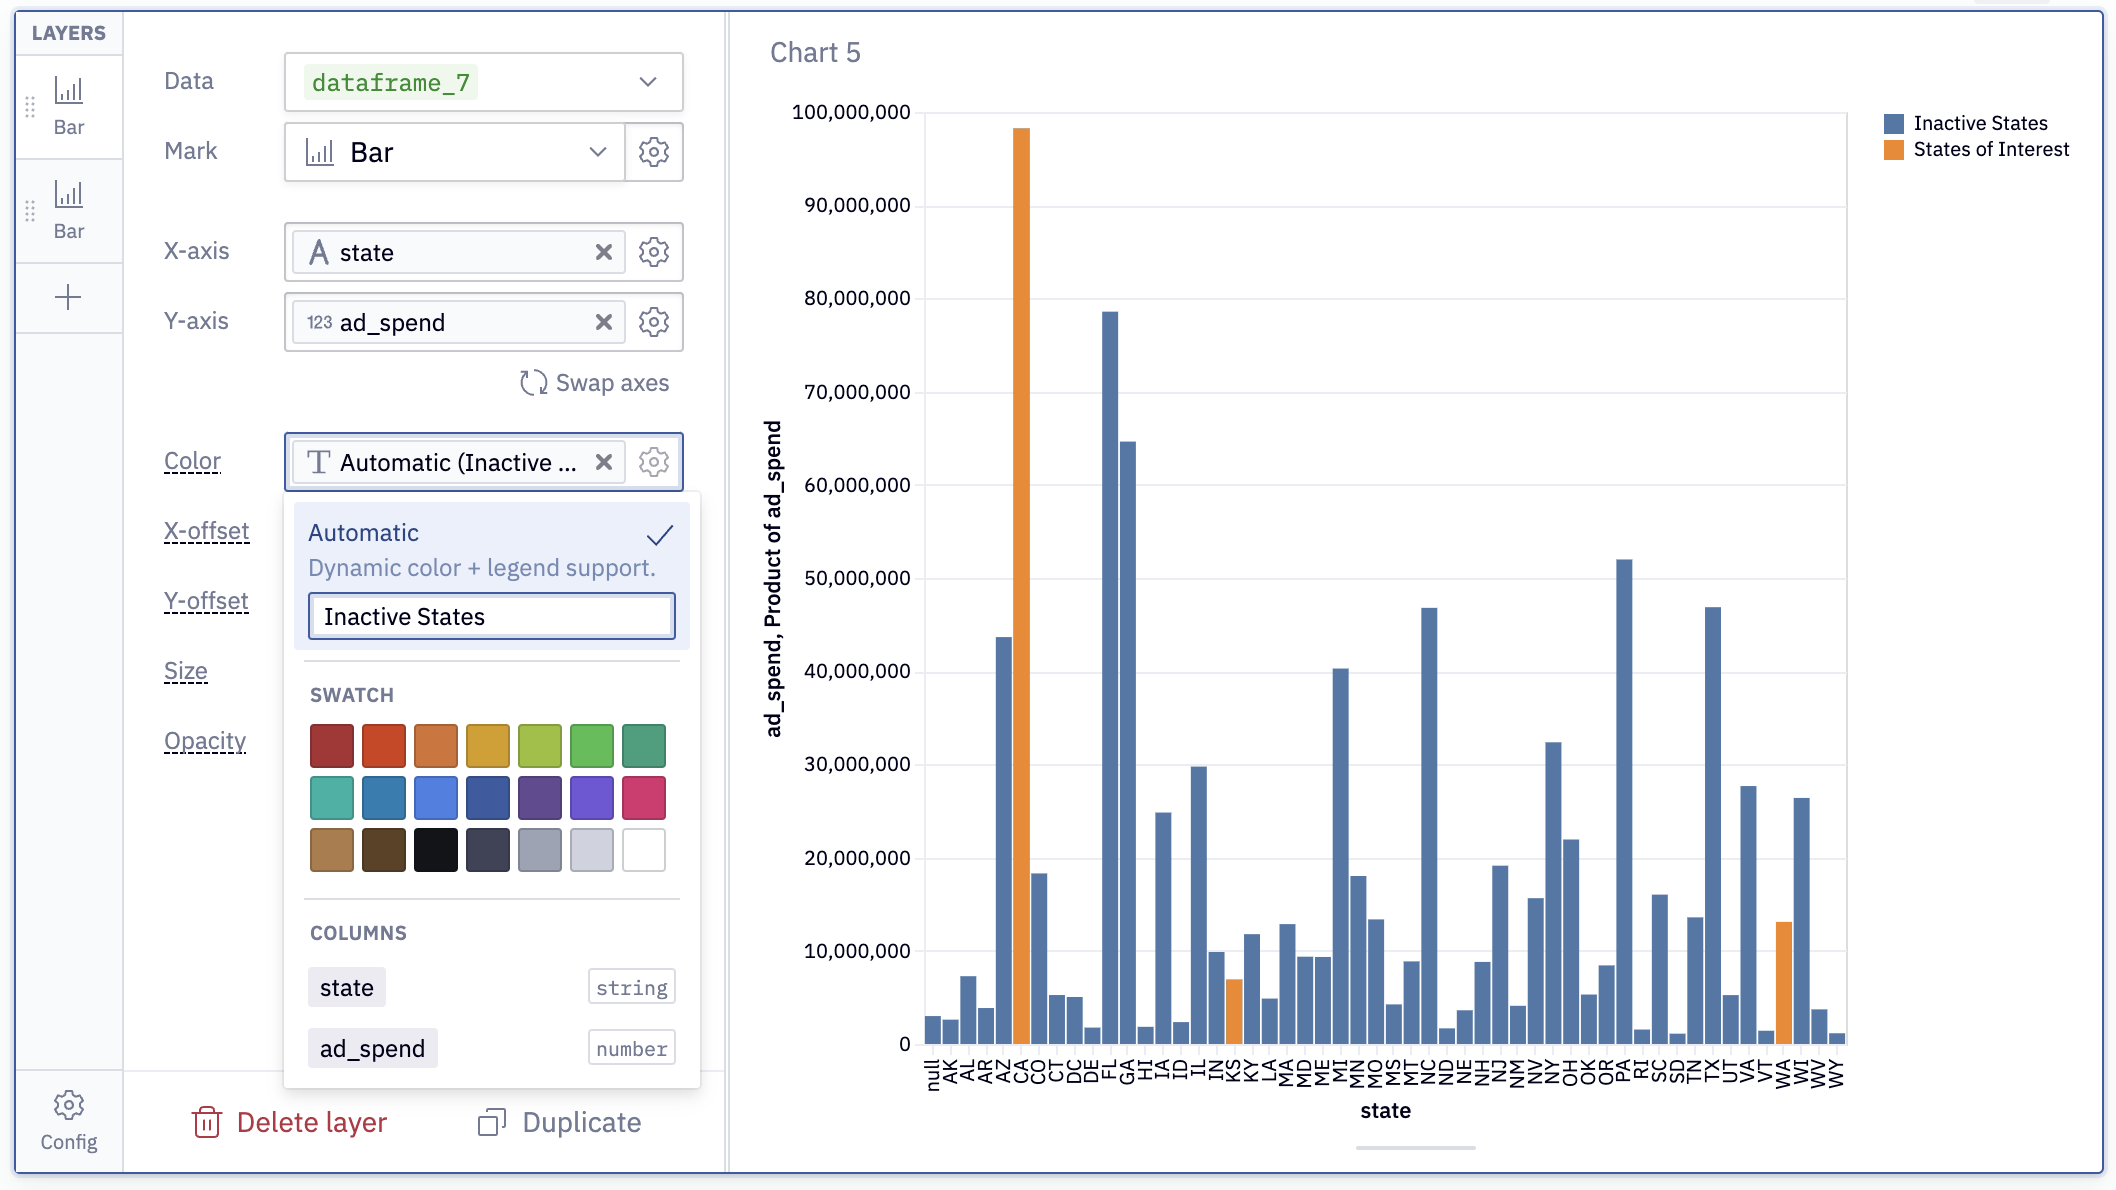
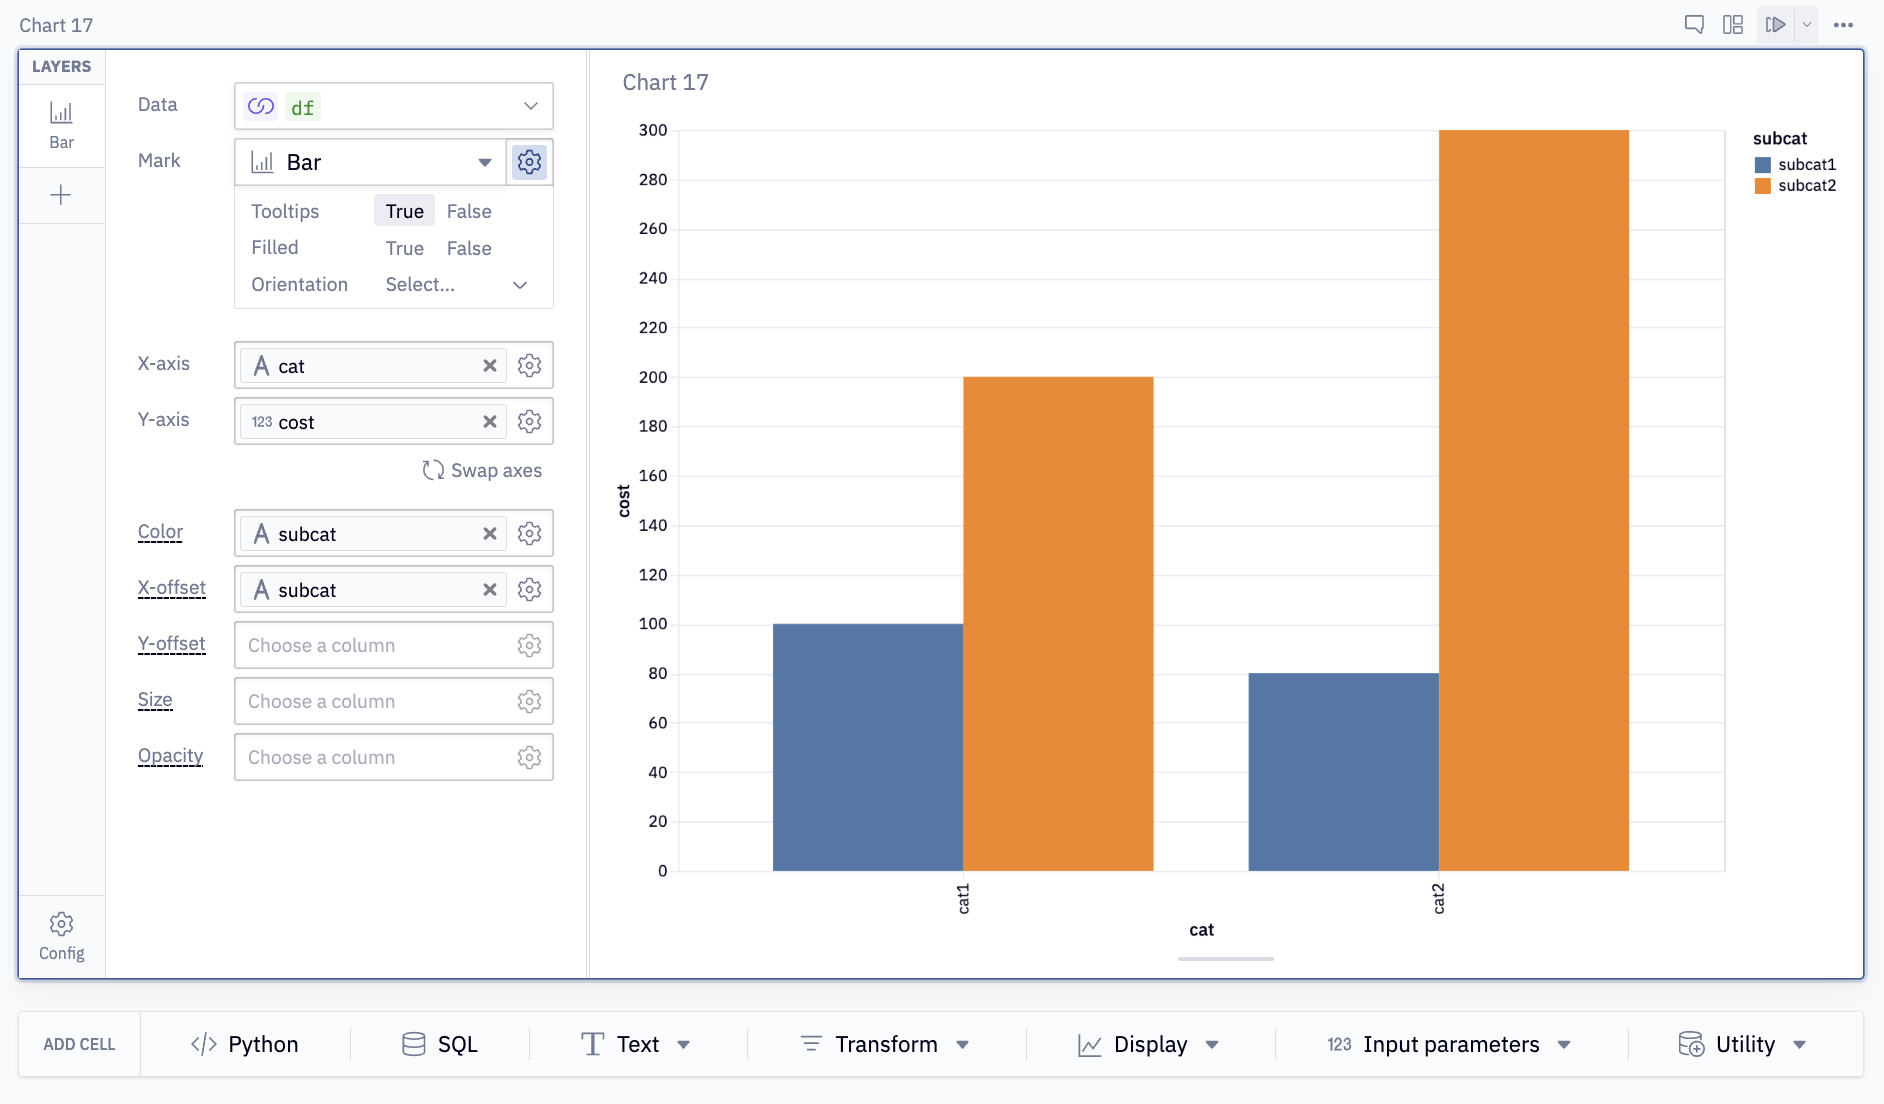
X and Y offsets
You can create grouped bar charts using the X or Y-offset config. To group a bar chart, select the same column in the Color and X-offset (or Y-offset, for a Y axis grouped chart). This will “offset” the location of each bar based on that value, creating a grouped layout.
Text layer
Text layers let you add labels and annotations anywhere on a chart. Select a column with the text to display, choose the X and Y columns that control label placement, and then fine-tune with the Dx, Dy, Angle, and Radius configs to place text exactly where you want it.
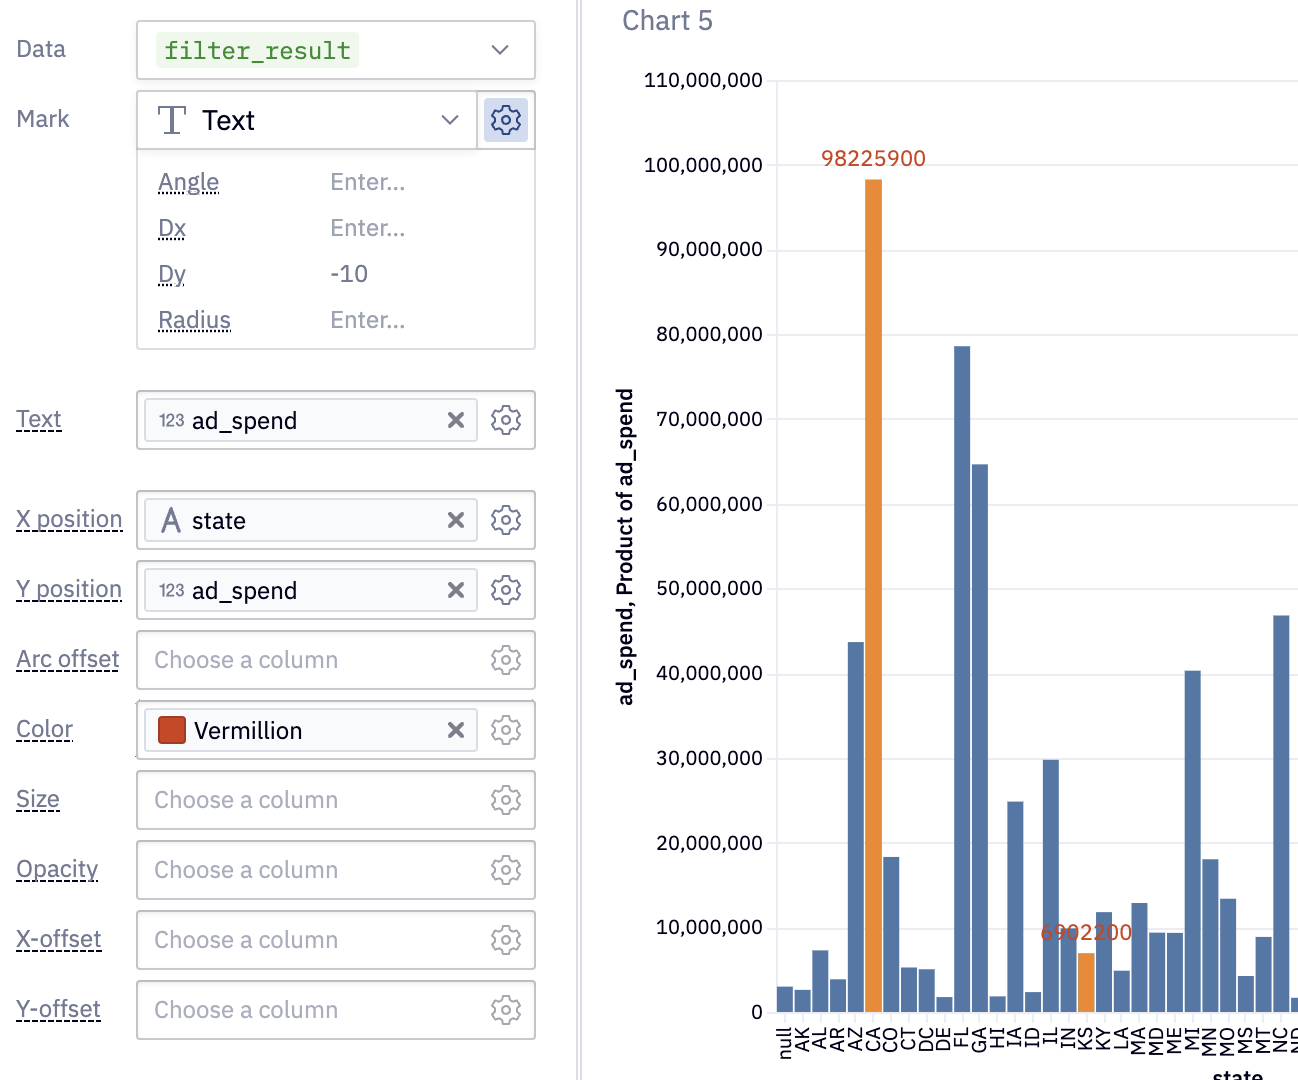
Use this to add more complex labels, or to call out specific points as important. It works great with Filter cells— filter down the dataframe powering the chart to just the records you want to annotate, and then add the filter_output as a new text layer.
🏡 Clickhouse integration
Everyone’s favorite super fast database now works out of the box with Hex. There’s nothing particular about the configuration— just add a new data connection, provide the usual authentication details, and you’re off writing Clickhouse queries in SQL cells.

🖼️ Screenshots in Library
The Library now features a screenshot of every app at time of most recent publish or scheduled run. We hope this makes it easier to find the app you’re looking for, before you click.
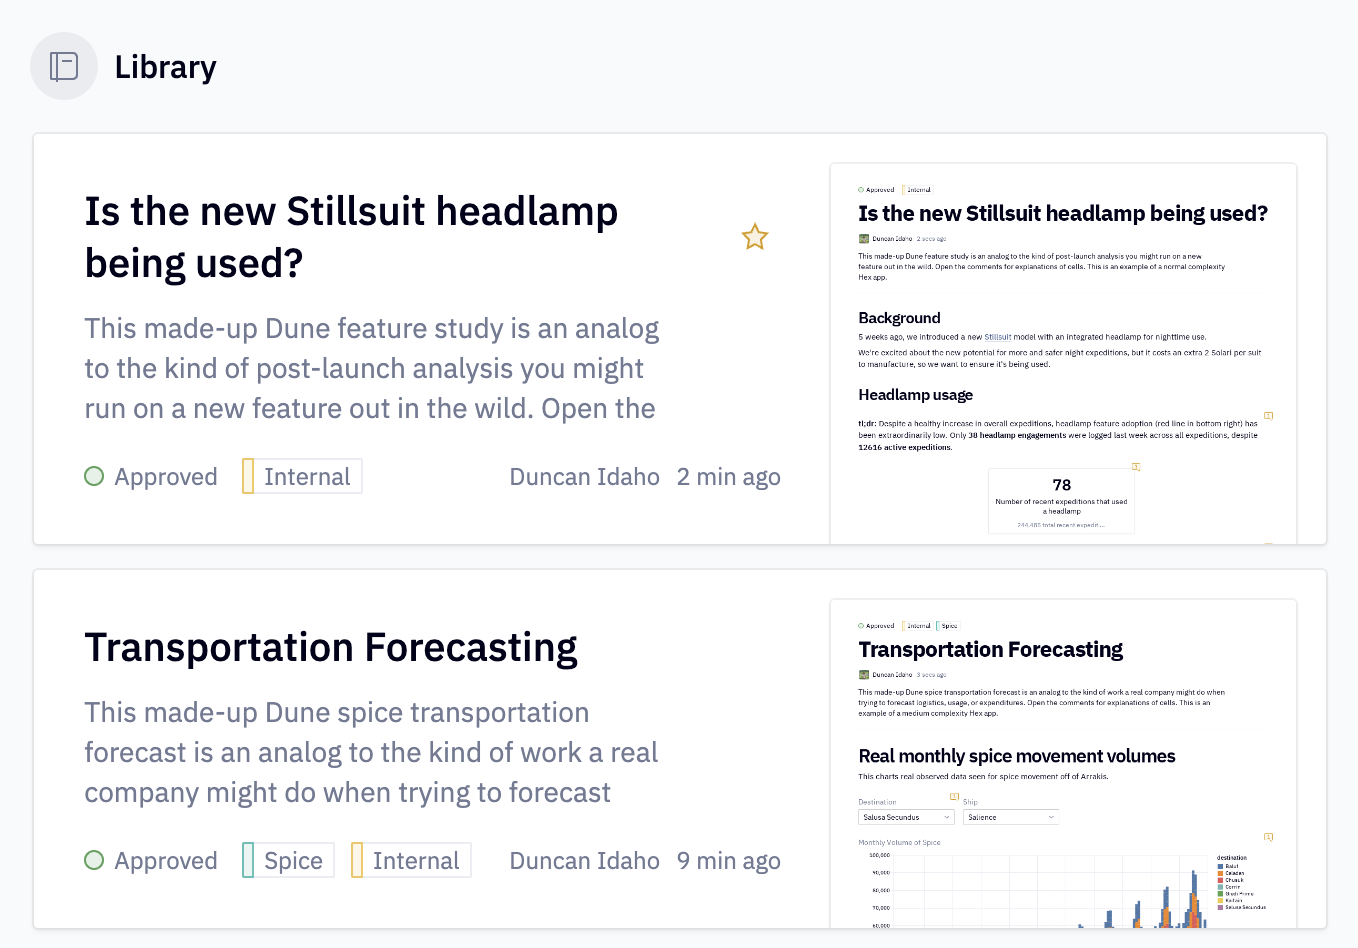
Unlike many libraries, we encourage you to judge your apps by their screenshots 😉.
Note: This will be empty for previously-published apps but will now populate the next time they are published or run on a schedule.
Other improvements
-
SQL cells in the same project now share one session. This is a mostly invisible change that lets power users set session params and write complex multi-statement or non-read-only queries.
-
If you’ve created a large app with lots of outputs, you can now Clear outputs from the project list view to wipe them clean.
-
We’ve banished some unnecessary scrollbars on text cells.
-
We fixed an issue that was causing lines and their points on chart cells to be misaligned— or as James put it, “missing the point entirely” 😑.

-
Transformed columns in Pivot cells now use underscores instead of parentheses as suffixes, like field_sum, field_year, etc. This makes them easier to work with downstream and in Writeback cells.