Today we’re shipping some huge improvements to make building and sharing beautiful, interactive experiences in Hex even better.
App viewers can now View and Explore the underlying data of charts and tables to quickly investigate an anomaly, look in more detail at a trend, or start their own downstream analysis— without having to start from scratch or make new data requests.
We’ve also updated our compute engine, so that all these app interactions are more performant and intuitive.
👀 View underlying data
App viewers can now see the underlying data behind charts by clicking the “View data” button.
View includes all columns in the underlying data, not just the ones being visualized! This lets you build beautiful, focused charts without worrying about how to provide access to the entire dataset.
This is only available to app viewers with “Can View” permissions, so you don’t need to worry about exposing raw data to everyone.
For charts that use aggregation or datetime truncation, View data gives you drill-down access to the unaggregated raw data. This means users can find a particular row, download the entire dataset, or use it to… drumroll please… Explore!
🧭 Explore
Every chart and table is now an interactive jumping-off point for app viewers to explore and answer their own questions.
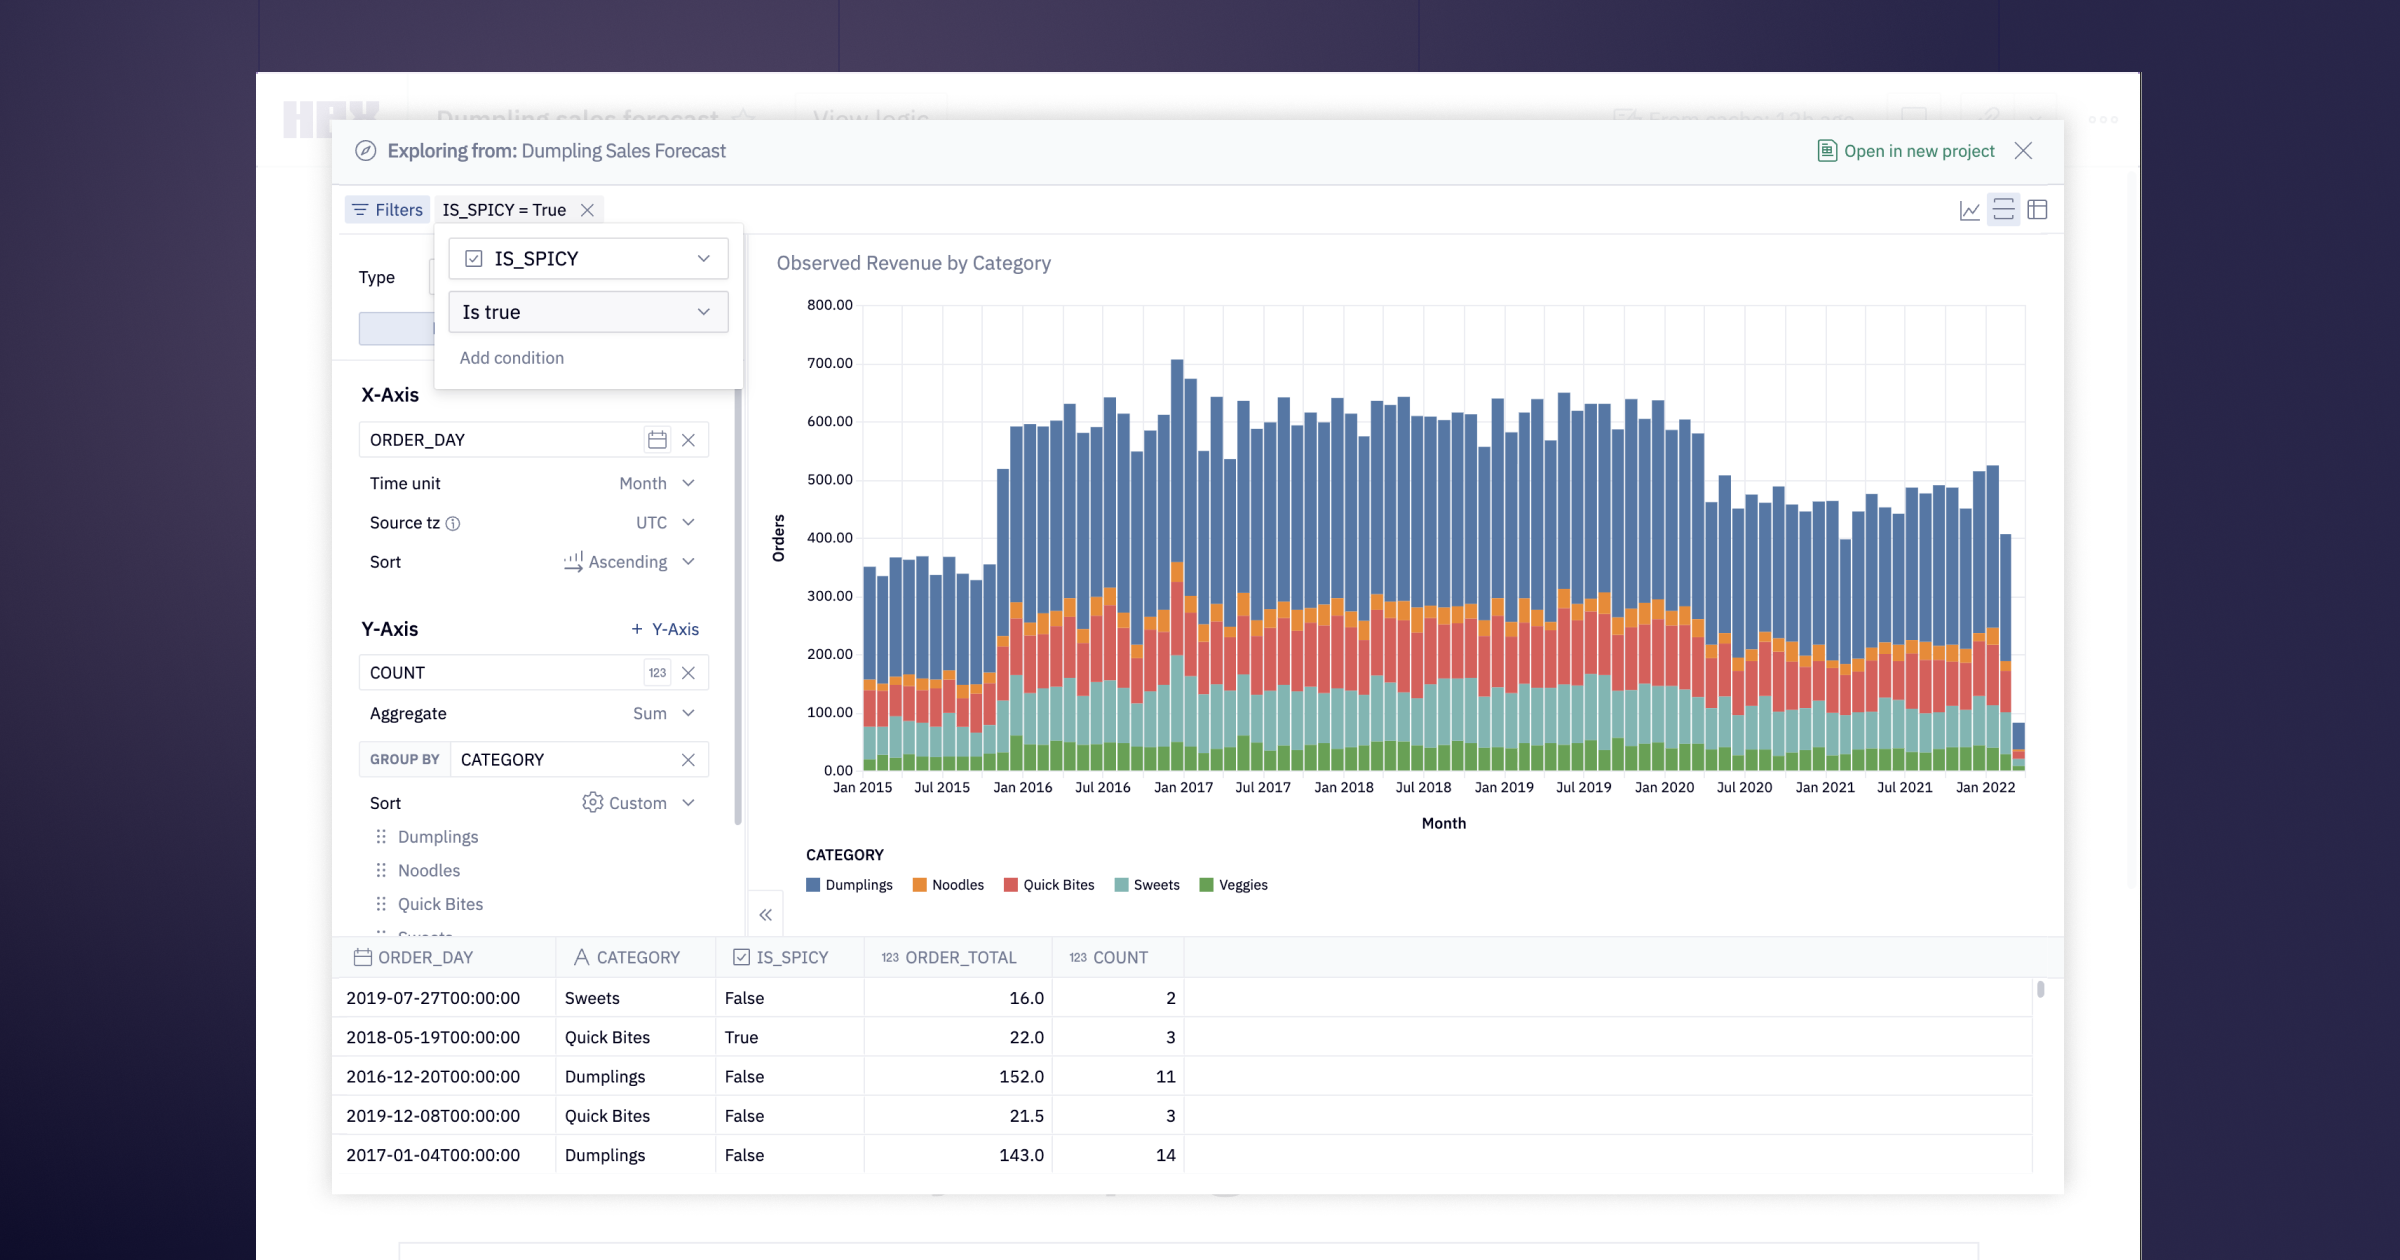
Users with editor seats will see a new Explore icon on published charts and tables. This opens a powerful exploration interface that lets you access the raw underlying data, add your own filters, and completely reshape and rebuild visualizations.
At first glance it looks like the standard Hex chart editor, but I guarantee you will be amazed at the kinds of questions you can answer with just this interface.
Found an interesting thread to pull on? Any exploration can be promoted to a full-fledged project with one click, so you can go as far down the rabbit hole as you need to.
Users must have a Hex editor seat as well as “Can view” permissions on an app to Explore.
🏃♀️ More intelligent re-runs
When you change multiple inputs in an app, Hex’s compute engine will now prioritize the last selection, and cancel the other queued runs.
Previously, if you made several input changes in an app, Hex would queue up one run of the project for each permutation of inputs. This meant you’d have to wait for all those runs to finish, bashfully flickering their already-outdated results at you until they were replaced by the final one.
Now, Hex is clever enough to cancel all outdated runs and just run the final version. This makes for way snappier interactivity, and lets you build apps with lots of inputs without worrying about the user experience.
Bonus: The compute engine also now ignores any SQL cells in your project that aren’t necessary to power the published app. Made possible by a little DAG magic, this means your leftover scratch queries won’t accidentally make an app slower for end users— and hey, you might even save a few bucks on your warehouse bill 🙂.
📰 Edit from app layout
We’ve improved the cell editing experience you get on the App Layout page.
Text and markdown cells can now be inline edited right from this view, so you don’t have to go back to the Notebook view to edit that placeholder text.
We’ve also made improvements to other cell types: Inputs and Single Value visualizations can also be edited inline, and all other cells can be edited in a full screen popup by clicking the ⚙️ icon.
Other improvements
-
It’s now possible to publish a project right from the scheduled run dialog, instead of getting an unhelpful “You need to publish this app first” message.
-
The history sidebar can be filtered to only show saved versions, making it easier to revert or browse past work.