Fresh round of Hex features plummeting towards you at relativistic speeds. (wait, does that mean they’re coming really fast, or slow? I guess it depends on your frame of reference… 😎)
💎 Trellis charts
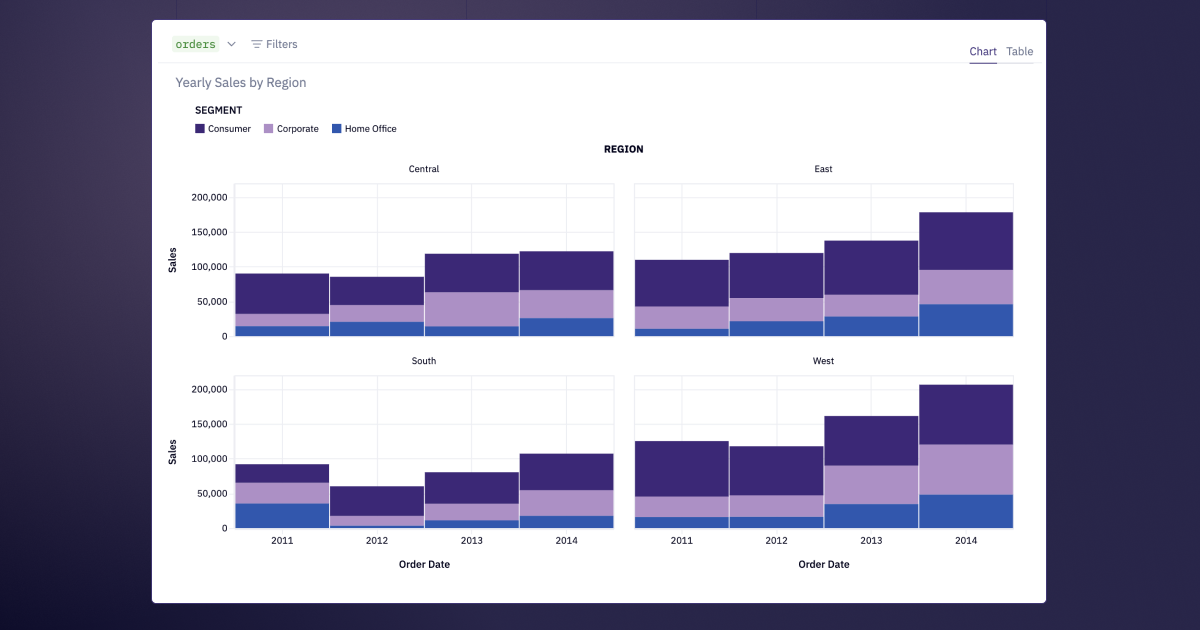
Chart cells now support faceting, so you can build beautiful, information-dense trellis charts with just a few clicks.
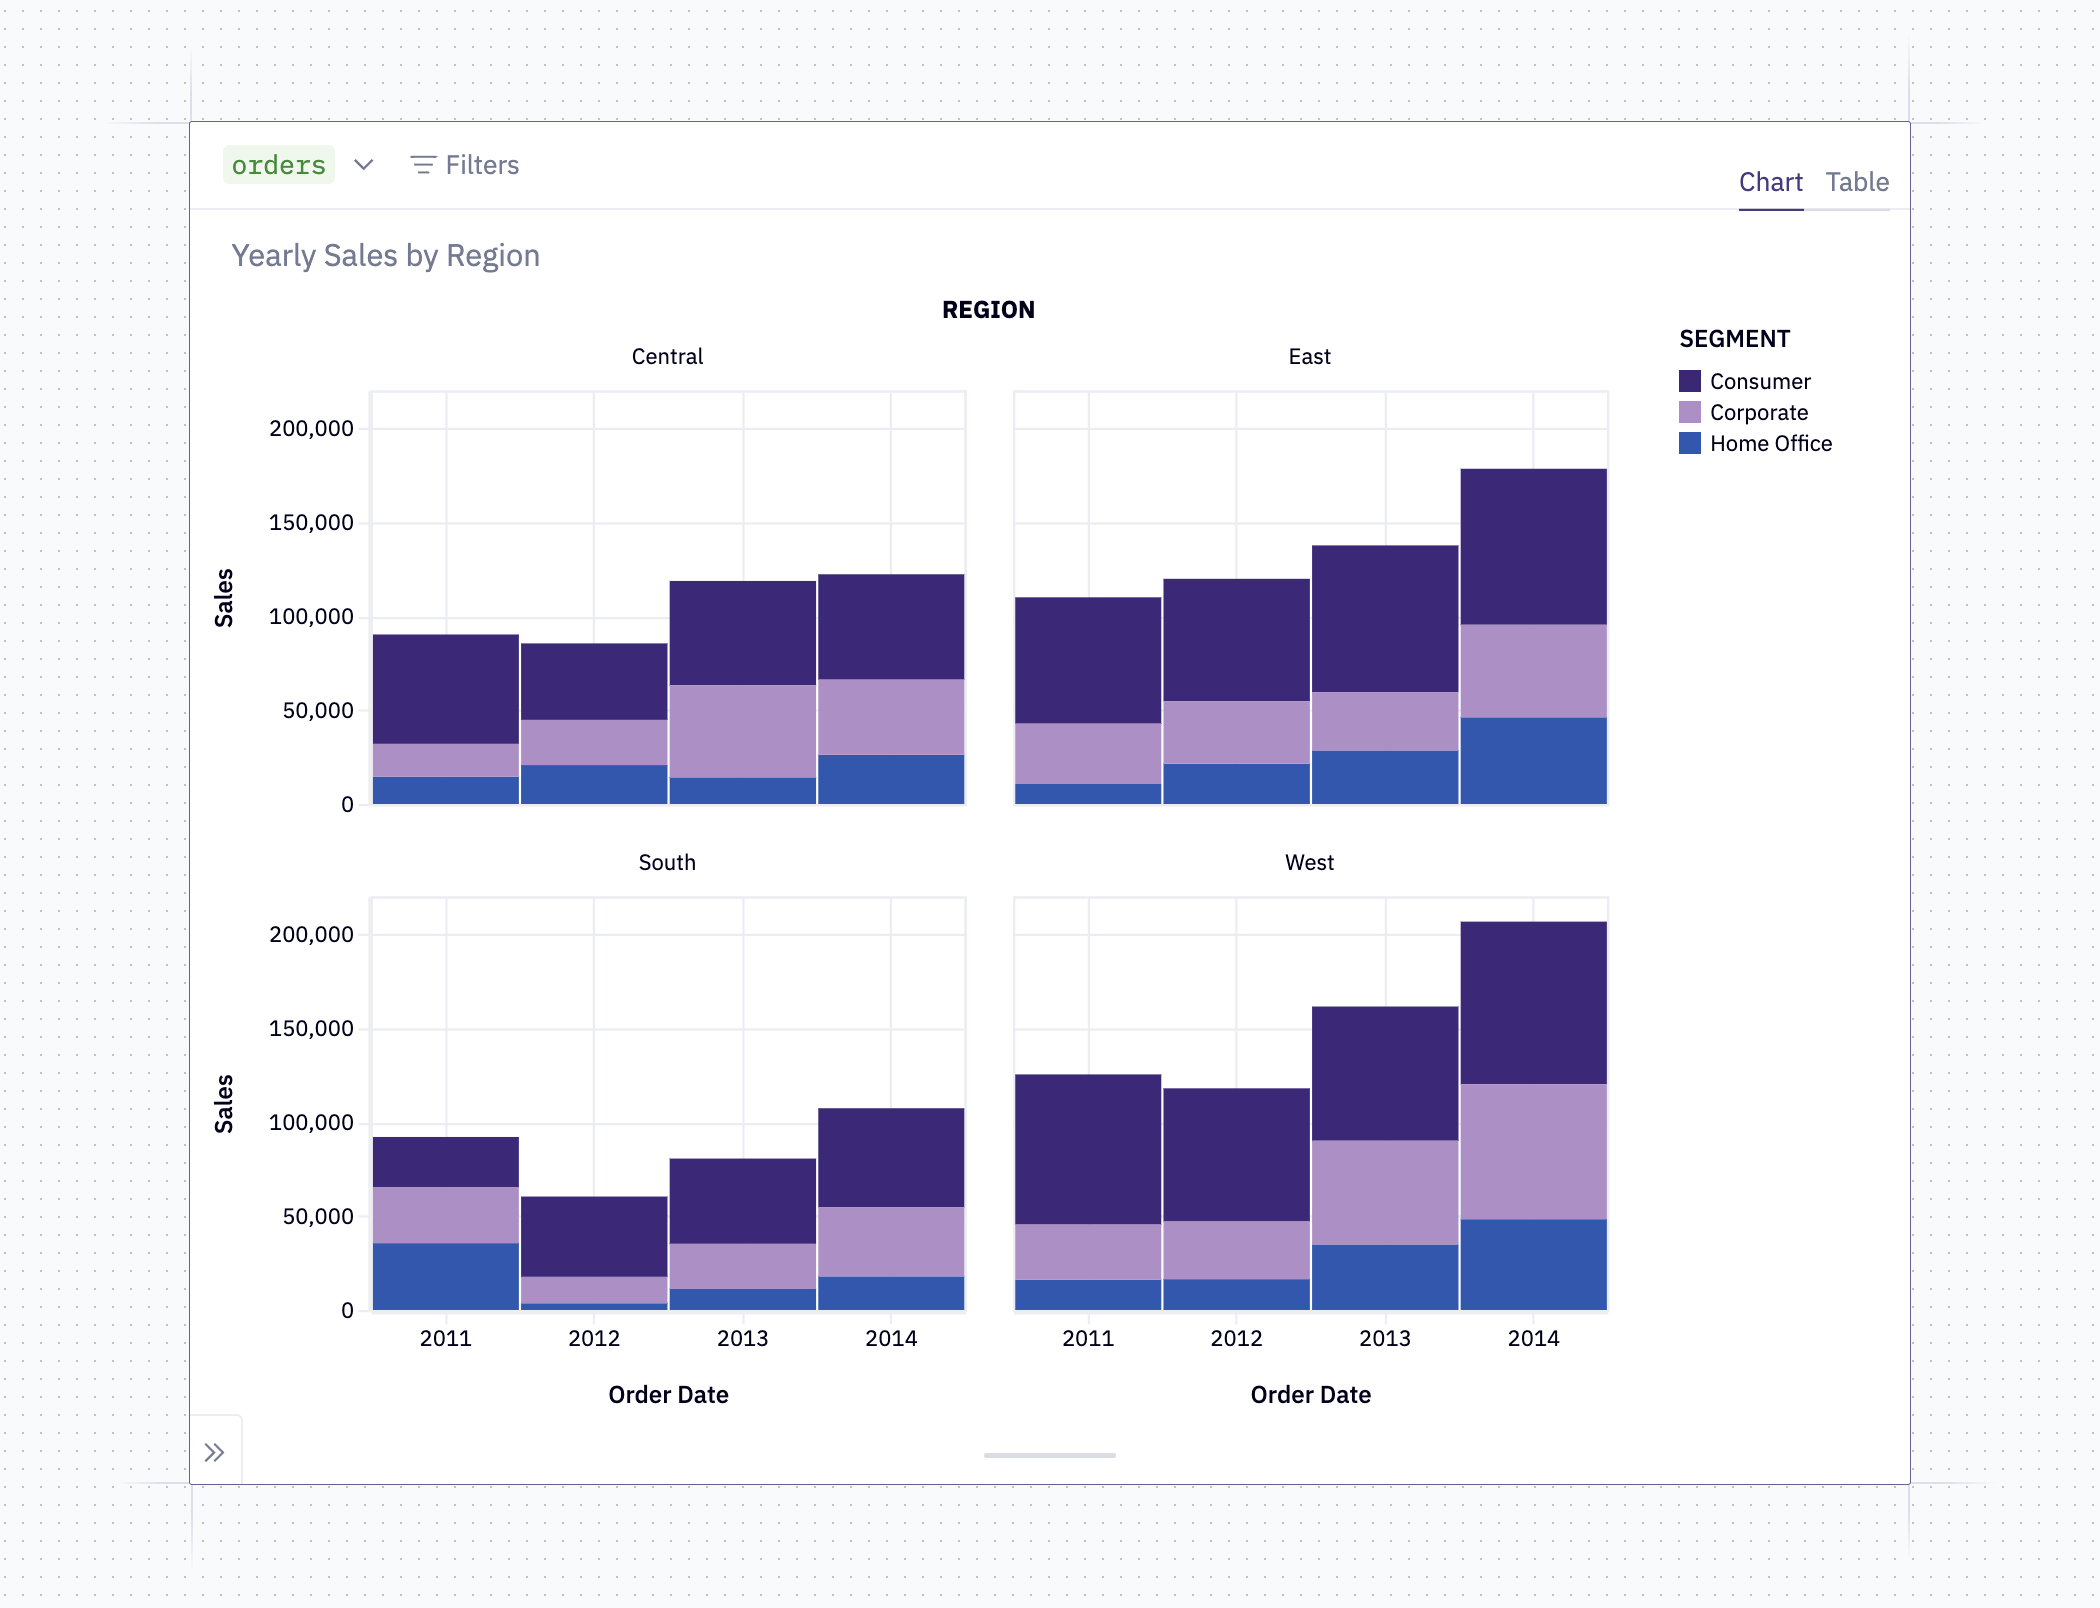
You might know these as trellis charts, small multiples, faceted charts, lattice charts, or just “that thing where the viz is split into a bunch of plots”. Whatever you call them, the premise is pretty simple: Choose a column to "facet" by, and your plot becomes a grid of subplots, broken out by that column.
This lets you display a lot more information without compromising— and often actually enhancing— the readability of a visualization. Done right, you can display 4 (or even 5, if you want to get really loco) dimensions of data at once.
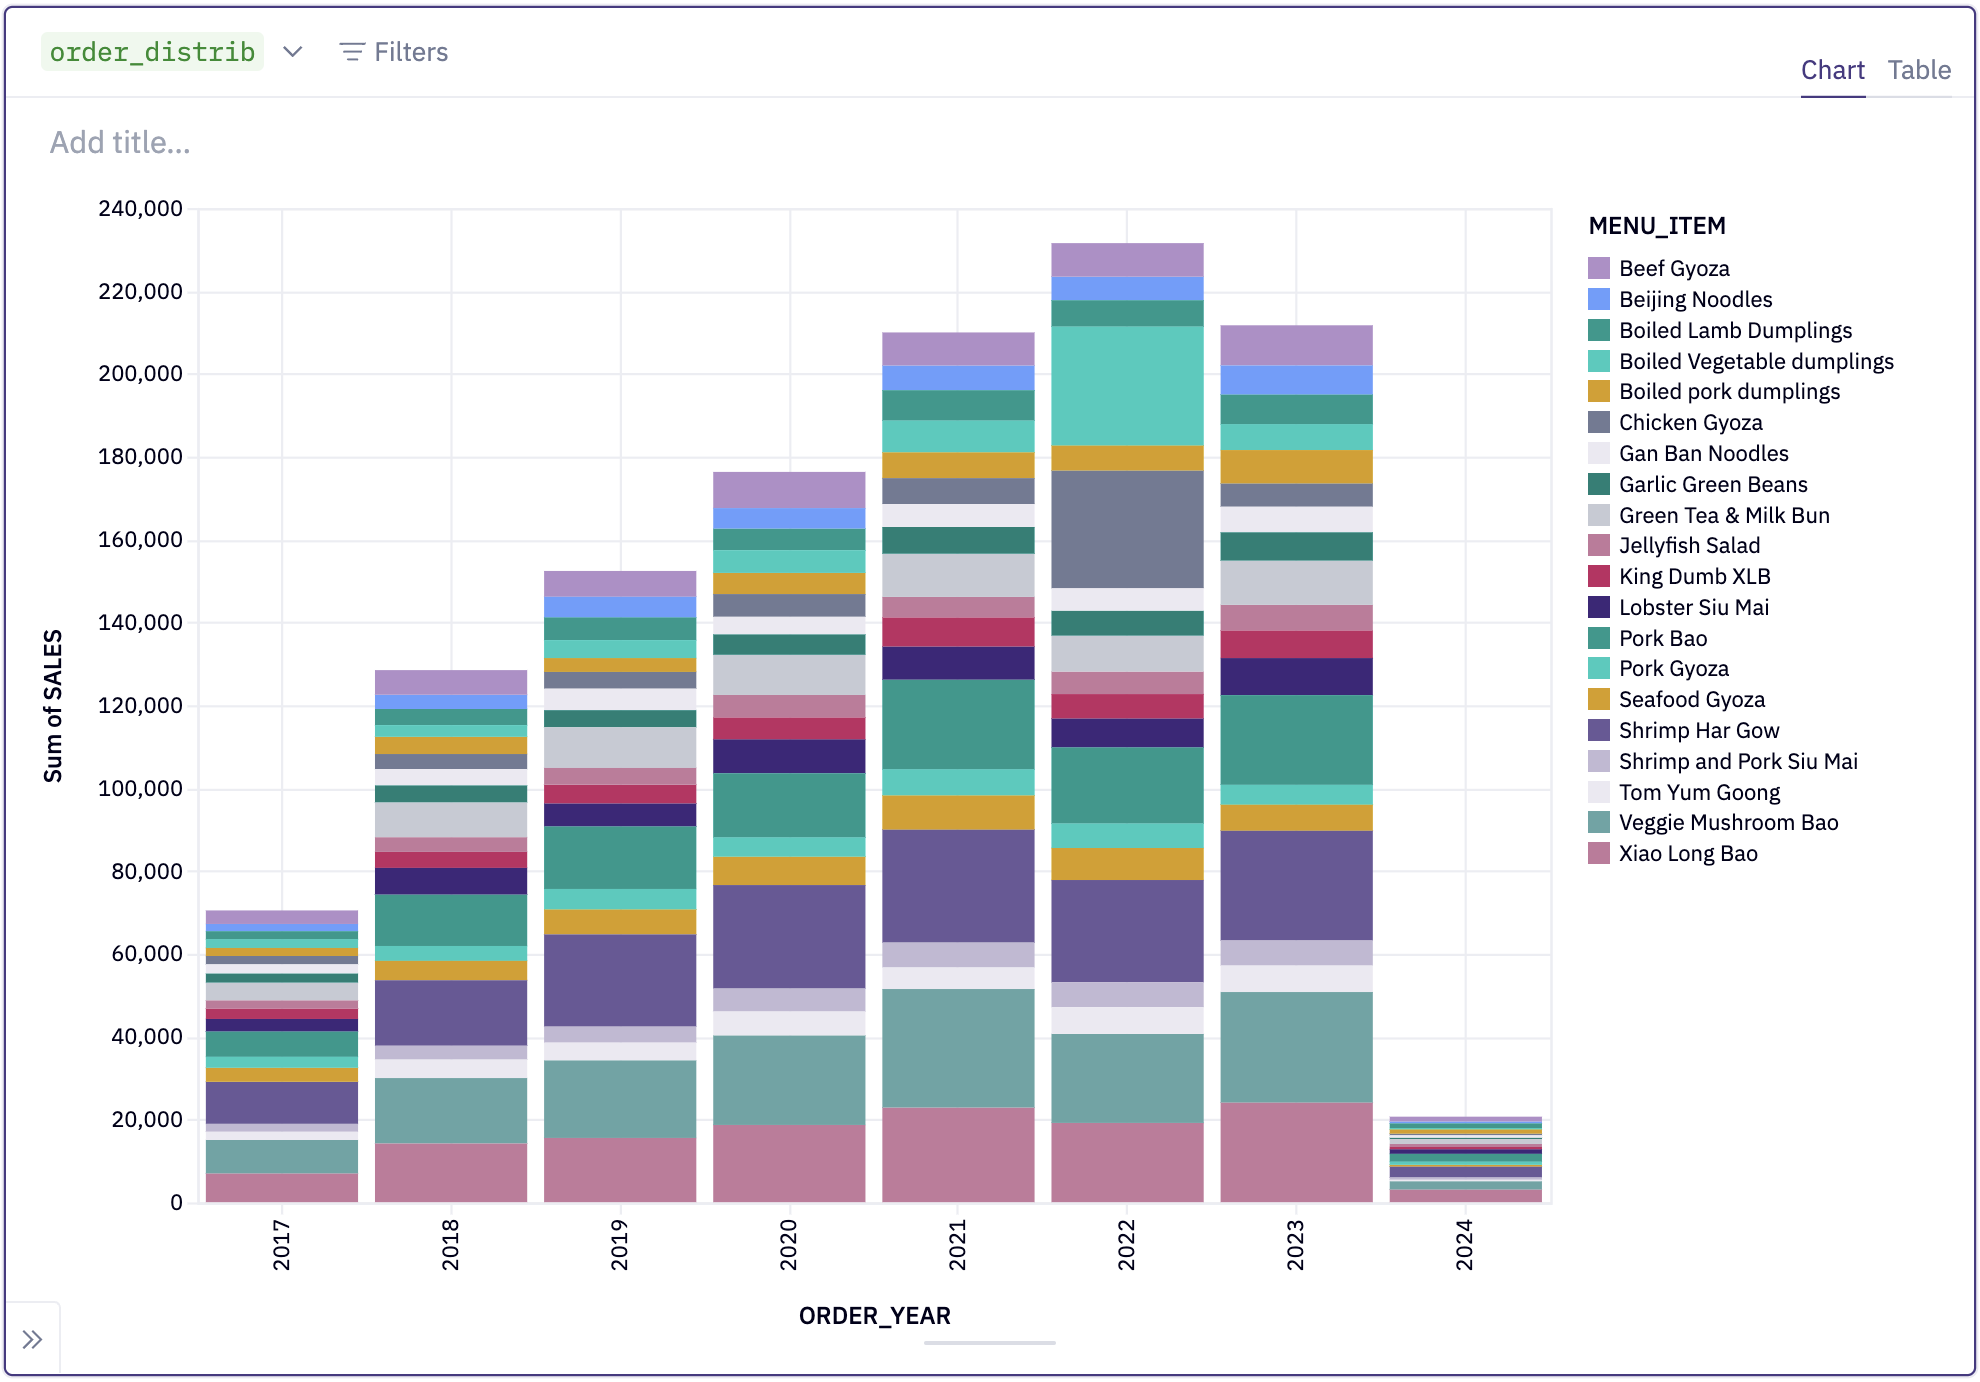
Here's a really quick example of improving a cluttered, confusing viz by turning it into a trellis chart. The initial state here makes it really tough to notice any year-over-year patterns in item sales:
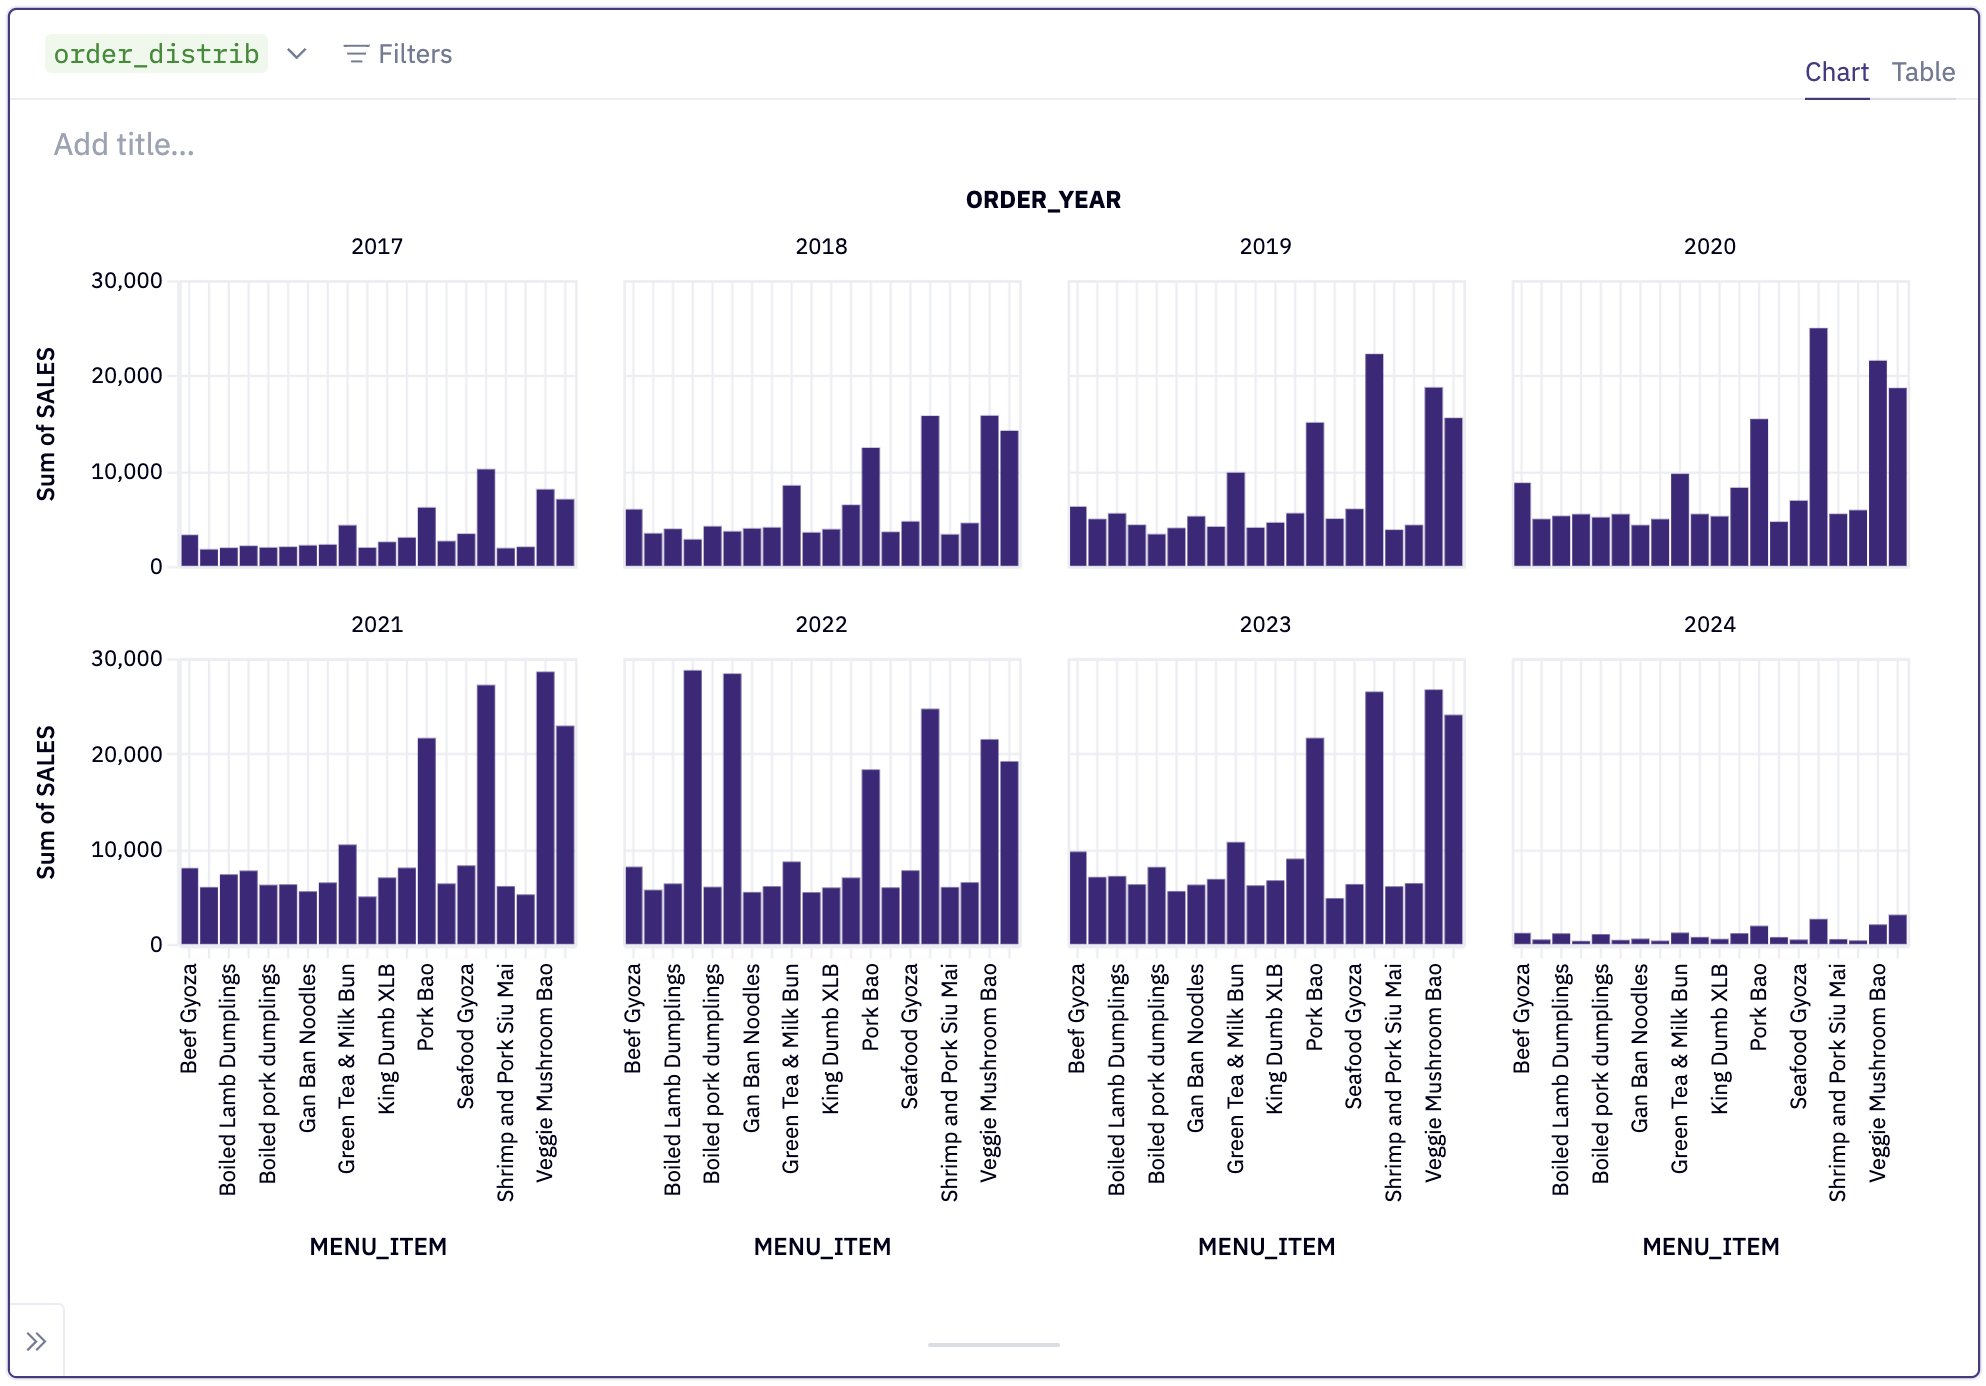
Breaking it out as a trellis chart faceted by year, it's immediately obvious that there's a crazy spike in two specific menu items in 2022. The entire chart is more readable, but the patterns in particular really leap out:
Sold yet? No? Trellis charts are really easy to configure too! Here's a 9 second gif of me going from screenshot 1 to screenshot 2 there, in real time. I count only 5 clicks!
And if you're still hungry for EVEN MORE trellis chart content... Here's a 3 minute video of me walking through the thought process behind that 9 second gif, which of course itself is an elongation of those two screenshots:
🗃️ Google Drive integration
Access Google Drive files directly from Hex, just like a locally uploaded file.
Once a Google Drive connection is configured in Workspace Assets settings, you’ll be able to browse and import files right from the Files sidebar of any Hex project.
You’re also able to natively write files to GDrive without any configuration or manual upload. Using a standard file.write() or dataframe.to_csv() with an external-files/googledrive/<your_drive>/<your_filename.csv> path will just work.
An important note: Because this is a workspace level connection, it's not possible to connect to a user's entire "My Drive". Instead, a Subdirectory ID is required to connect to a specific folder in Drive. To find your Subdirectory ID, navigate to the directory in Google Drive, and copy the ID after folders/ in the URL.
🩺 Magic for PHI
HIPAA compliant customers of Hex can now make full use of our Magic AI features.
Hex’s Magic AI (Artificial Intelligence) features are powered by OpenAI, who we now have a BAA (Business Associate Agreement) in place with that allows them to process PHI (Protected Health Information) data for our customers.
This means customers of Hex that must maintain HIPAA (Health Insurance Portability and Accountability Act) compliance are now able to use Magic!
Workspace admins can enable Magic and configure the Data Manager from the Workspace Settings > Magic page. For more about our commitments to data privacy and security, visit trust.hex.tech.
Other improvements
- We’ve added some handy new keyboard shortcuts to make working in large projects easier. Go try these right now so you bake in the muscle memory! I promise they will make you faster at using Hex.
- Option + ⬆︎ and Option + ⬇︎: Jump to the top / bottom of the notebook
- Cmd + [ and Cmd + ]: Step forward / backward through cells in the order you most recently edited them.
- You can also access these from the command palette (Cmd + P)
- The Bigquery DataFrames (bigframes) package is now installed by default, and users of BigQuery can create a new BigFrames session using hextoolkit. Stay tuned for more here 😉.