Today we're launching Explore — a powerful new way for anyone to analyze data in Hex without writing code. This release brings drag & drop analytics to Hex, along with major improvements to Magic AI, new semantic layer integrations, and data-driven notifications.
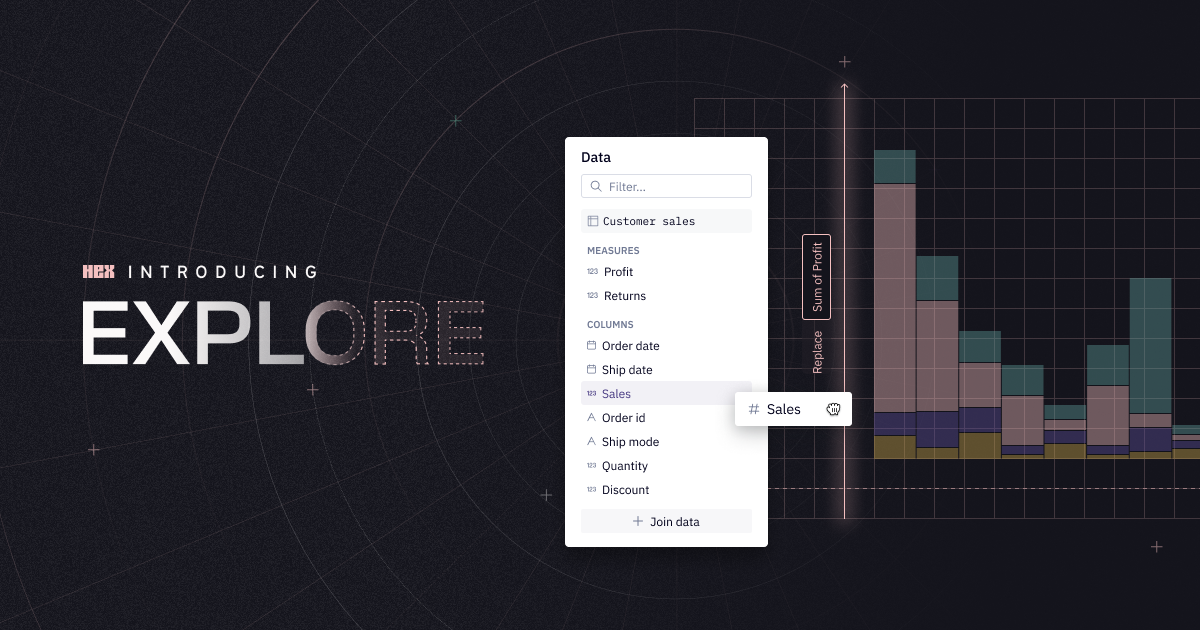
🔍 Explore: Visual Analytics for Everyone
Build complex analyses by dragging dimensions and measures onto a visual canvas — no SQL or Python required.
Our new drag & drop interface lets business users answer their own data questions without constantly tapping the data team. Explore brings together several powerful capabilities:
- Visual Builder: Drag dimensions and measures to create detailed visualizations and tables
- Spreadsheet Calculations: Build custom logic using familiar spreadsheet formulas
- No-code Joins: Merge tables with automatic key detection and fan-out deduplication
- App Integration: Drill directly into the underlying data of any Hex app
- Notebook Chaining: Connect Explores with SQL, Python, or other Explores to build complex analyses
Explore is available as a cell in notebooks on all plans and as a standalone UI on Teams and Enterprise Plans.
🪄 Enhanced Magic AI
Magic AI now helps anyone find the right data and start new analyses.
Ask Magic questions like "Which launch emails had the highest engagement?" and it will:
- Recommend existing, endorsed analyses that might answer your question
- Offer to start a new Explore to build the analysis from scratch
Enhanced Magic AI capabilities are currently in private beta. Email [email protected] to join.
📚 Semantic Layer Integration
Sync your existing semantic definitions directly into Hex's data browser and Magic AI.
Your semantic models can now guide users to the right data across Hex:
- Import measures and join relationships
- Surface semantic concepts in Explore and the data browser
- Enhance Magic AI's understanding of your data
LookML sync is in private beta today. dbt MetricFlow integration coming soon.
🔔 Conditional Notifications
Set up alerts when metrics hit milestones or encounter issues.
Users can now configure their own data-driven alerts:
- Set conditions based on metric values
- Receive notifications via email or Slack
- Choose between scheduled or data-triggered alerts
📅 Upcoming Explore Events
Want to learn more about these new features? Join us for these upcoming sessions:
- Wed, Nov 13: Data Teams & Business Users: A Match Made in Hex - with CEO Barry McCardel
- Wed, Nov 20: Explore the New Frontiers of No-Code in Hex - with PM Sarah Tayeri
- Wed, Dec 4: A Little Magic, A Lot of Data, and Trusted Answers for All - with PM Olivia Koshy
Sign up through your Hex workspace or contact our team for registration details.
🔒 An update on Hex project permissions
An important change is coming to Hex's project permissions
Previously, Viewers in a workspace could be given one of two different project permissions:
- Can view: Allows users to view the published app and the notebook of a project, including unpublished projects. This permission also allowed users to view data powering a chart, or explore charts and tables included in a published app if the user has an Editor seat.
- App Only: allows users to view and comment on only the published app.
We're updating these project permissions to the following on December 2.
- The Can view permission is being relabelled to Can explore to better reflect the capabilities included in this project role. Can explore permissions are only available to Editors.
- Viewers in a workspace can only be granted the Can view app project role, to ensure they are viewing work that has been marked "ready for consumption" by being published.
| Capability | Can explore | Can view app |
|---|---|---|
| Previous name | Can view | App only |
| Required workspace role | Editor | Viewer |
| Create and view saved Explores from Published App | ✓ | |
| View Data from Published App | ✓ | |
| View and comment on Notebook view (including unpublished projects) | ✓ | |
| View, comment, and use inputs on Published App | ✓ | ✓ |
| Download data from published table displays | ✓ | ✓ |
| Receive scheduled deliveries set up by someone else | ✓ | ✓ |
There are two consequences of this change for Viewers in a workspace:
- Viewers will no longer be able to view the Notebook of a project. If a Viewer relies on unpublished notebooks as a source of information, consider publishing the project to give them access.
- Viewers will no longer be able to use the View Data feature on a published app. If a Viewer relies on this feature to access a tabular version of a chart's data, consider updating the app to include a Table display cell
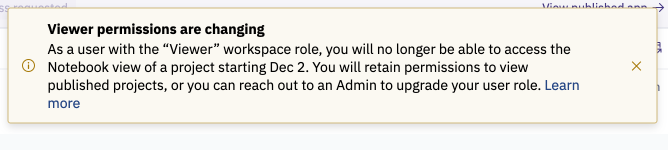
Until the changes take effect on December 2, we'll notify Viewers in-product if they are taking actions that will no longer be available.