Explore
Explore allows anyone to ask and answer questions from data without needing code. Explorations use a drag-and-drop interface that allows users to quickly visualize their data in charts, pivots, and tables. Explorations also provide methods to group and aggregate data, create spreadsheet calculations, filter data, and join tables together.
Explore shows up in two places in Hex:
- Exploring from a published app
- Exploring directly on a database table or semantic model
- Exploring from a published app or directly on a data object is available on Teams and Enterprise plans.
- Users need an Explorer role or higher to use explore features.
- Users need Can explore permissions or higher on a project in order to explore from the published app.
Where to use Explore
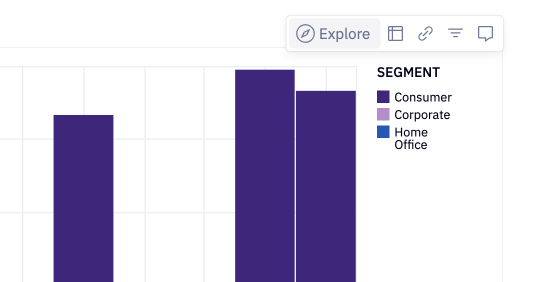
To explore from a published app, hover over a chart cell, table, or pivot table, and click Explore. The data source of the exploration will be the dataframe or database table that the project creator chose as the source of that cell.
To explore directly on a data connection, there are many entry points:
- From the + New project button in the home page, use the dropdown to select New exploration. From here, a database table can be selected as the data source.
- From the Explorations tab in the home page, click New exploration in the upper right. From here, a database table or semantic model can be selected as the data source.
- From the home page, use the 3-dot menu from a database table in the “Recent data” section and click Explore. This will create an exploration with the table as its data source.
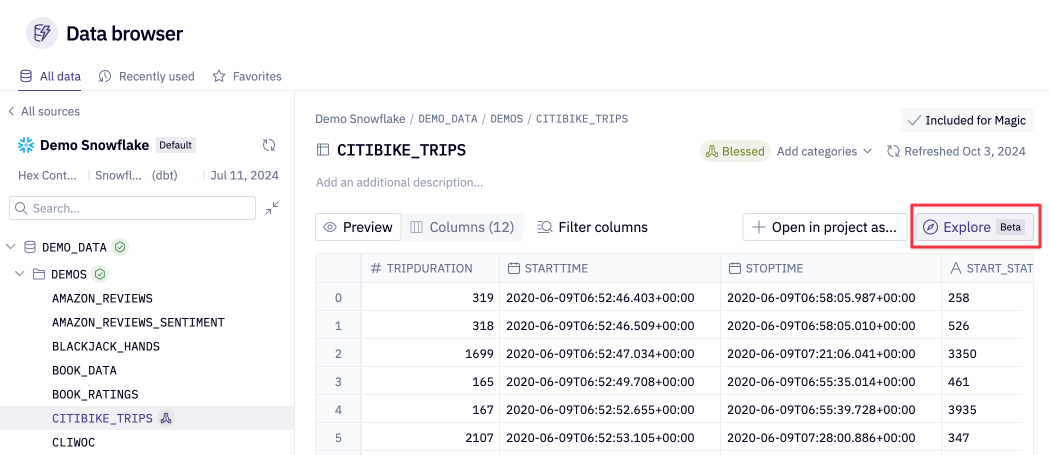
- Access the Data Browser via the Data tab on the left side of the home page and use it to find your desired table. From the table preview, click Explore. This will create an exploration with the table as its data source.
To use explore functionality in a notebook, add a Chart or Pivot cell from the add-cell bar.
Exploration functionality
Within an exploration, you can choose to view a visualization, a table, or a split screen displaying both options. Toggle between these choices at the top of the exploration.
The table and visualization always reflect the same data, with the table providing a tabular representation of the chart's contents. They will remain in sync as you make changes. To change the visualization type, click the chart type dropdown when the toggle is set to show a visualization.
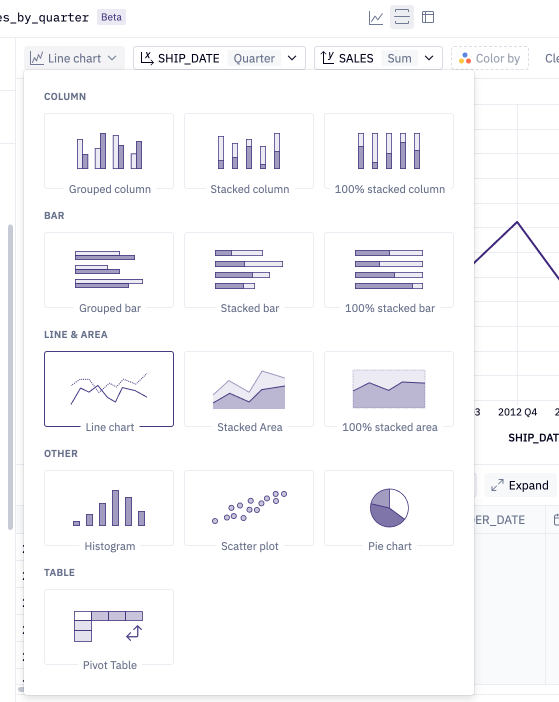
Users can drag and drop columns from the field picker into the drop zones of the chart in order to render a visualization. Alternatively, users can click on the pills above the chart in order to assign columns to different chart configs (like X-Axis and Y-axis), or use the + from fields in the field picker to assign to chart configs. Click Show options in the upper right to configure more advanced chart details.
To create a pivot table, click Pivot Table from the chart type dropdown in the upper left of your exploration. Drag and drop columns from the field picker into the drop zones of the pivot in order to add fields as rows, columns, or values. It's also possible to click on the pills in the top bar above the pivot in order to assign the pivot configs, or use the + from the fields in the field picker.
Actions like formatting, selecting time units, and setting scale types can be performed by clicking on the headers of fields in the table, or by clicking on the configuration pills above the chart or table.
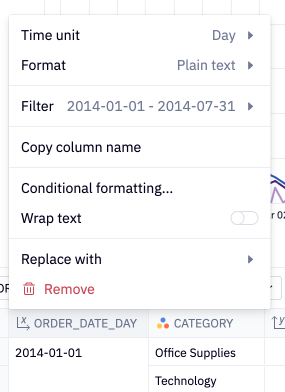
To filter, use the Filters section in the upper left. Alternatively, click any place where the column appears (the field picker, column headers in table, or pills above the chart or table) to pull up the column configuration menu, and click Filter... to pull up the filter config.
You can apply filters on both dimensions and measures. Dimension filters translate into SQL WHERE clauses applied directly to the source data. Measure filters become SQL HAVING clauses, applied after the data has been grouped and aggregated. Note: When filtering on a measure, ensure that measure is included in your chart or pivot table.
To group or aggregate data directly in the table, drag a column towards the table to see the Group by and Aggregation drop zones. Alternatively, click the empty Group by and Aggregation pills above a table to configure.
Tables have detail columns, which do not impact your visualization but do allow you to see the raw rows that make up the tabular data. These detail columns can be especially helpful when you want to understand the row-level data that makes up the values represented in a chart. To add or remove detail columns, click the pill for Edit detail columns above the table, or drag columns into the Detail table drop zone from the field picker. To collapse or expand the detail columns, use the Expand and Collapse buttons above the table.
Exploring with semantic models
In addition to exploring from database tables and dataframes, you can explore semantic models configured by an Admin in your workspace. When selecting data in a new exploration, navigate to the Data models tab at the top. From there, search and explore your semantic projects and models, and view the measures and dimensions of your models. Once you've identified the model you'd like to work with, select Explore.
Editors can also explore models from semantic projects in Chart cells within a Notebook.
Joins
Joins are currently only supported for explorations that use a database table as their data source.
To join data from another database table, click the + in the upper right of the field picker, or the + Join data button at the bottom of the field picker. This will bring up the Data Browser, from which a target table can be selected.
In the modal, select the columns to perform the join on, and the unique key columns for each table. Hex will make a best guess at what the joining and unique columns should be, but will display a warning if no columns can be detected or if an issue is detected with your selected columns.
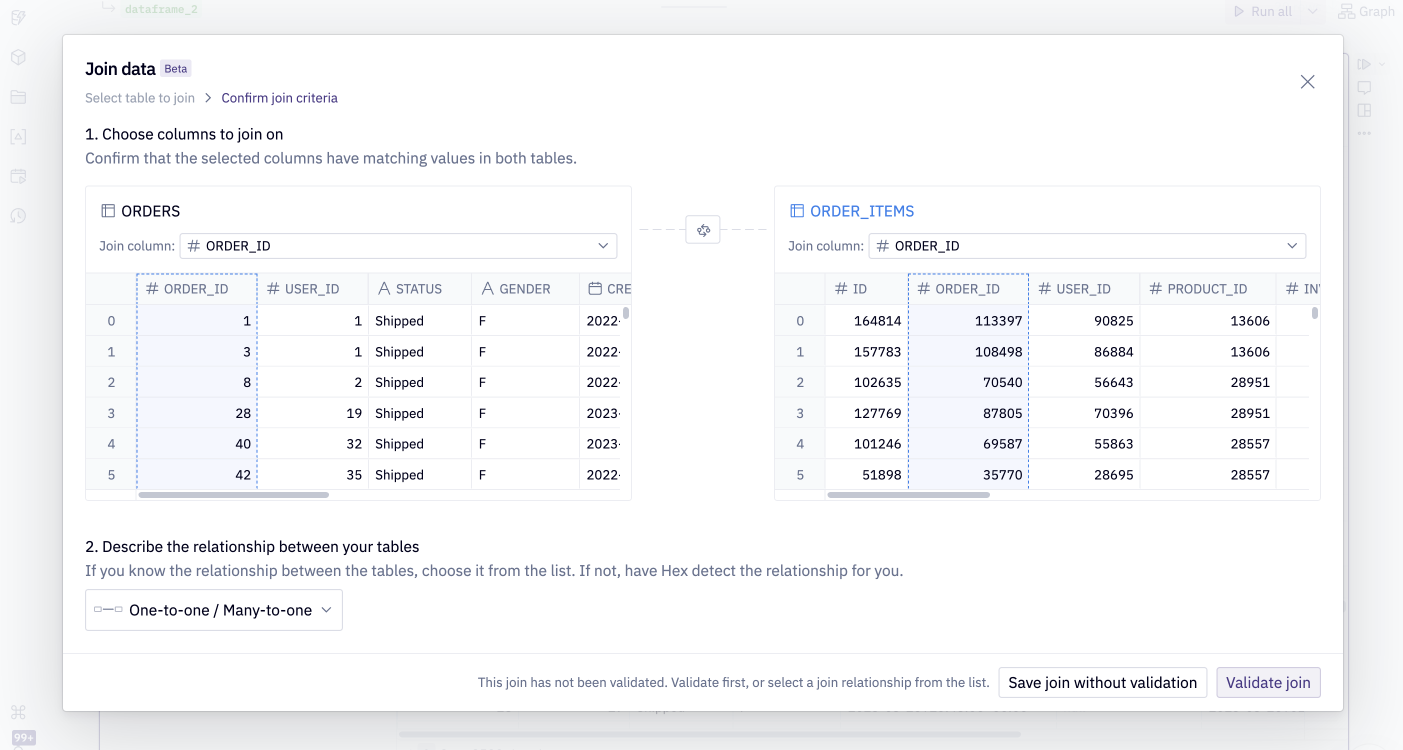
When creating joins between tables, there are two modes: simple join and advanced join. Each mode has different validation behaviors and requirements, designed to help you ensure your data relationships are accurate.

Simple join
For most common use cases, use a simple join without needing to manually select unique keys from each table.
-
Automatic Fanout Detection: During validation, Hex checks whether the join results in fanout (i.e., one row in the left table matching multiple rows in the right table).
-
Swap Recommendation: If fanout is detected, a warning will pop up to suggest swapping the table order. Swapping can resolve the fanout if the join becomes many-to-one (i.e., each row in the new left table matches at most one row in the right table).
Limitations: If the relationship between the tables is truly many-to-many, swapping won’t help. In that case, use an advanced join.
Advanced join
Advanced join allows for more control and is required when dealing with many-to-many relationships or when a user wants to be explicit about join uniqueness.
-
Unique Keys Required: Select a unique key from each table. These keys define the join and are used to validate its safety.
-
Key Uniqueness Check: When validating an advanced join, Hex check whether the selected keys are actually unique. If either key is not unique, a warning will show that the join may be unsafe.
Skipping Validation (Force Save)
There is the option to save joins without validation. This can be useful if a user is confident in the data model and want to bypass validation delays.
Use with caution! Skipping validation may lead to unsafe joins. If the wrong join type is selected and the data doesn't match expectations, you could get inaccurate or duplicated results. This is recommended for power users or cases where a user is absolutely certain of the data relationships.
After Validate join is clicked, Hex will validate the join and detect duplicate rows that may arise as a result of the join. Using the unique keys specified, Hex can accurately calculate aggregations on the base and joining tables of one-to-one, many-to-one, one-to-many, and many-to-many joins.
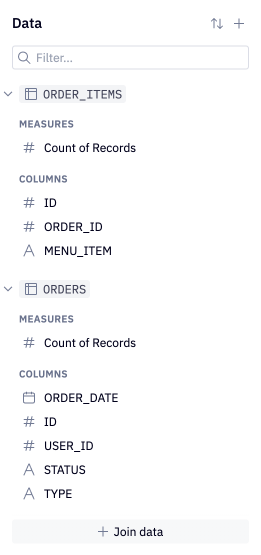
Once the validation is complete or skipped, Hex performs a left join from the base table to the joining table. The columns from the joining table will appear in the field picker of the exploration.
Calculations
To add a calculation, click + next to Dimensions or Measures on the left of the exploration, or click + in the table below the exploration.
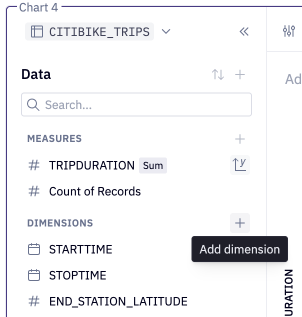
Function definitions, supported syntax, and rules can be found here. Once a calculation is defined, it can be added to a visualization or table, like any other column.
In Explore, calculations that use aggregation functions like Sum(), Count() will be represented as measures, and can be used with grouped fields to compare statistics between categories, or over time.
If your exploration has a join configured, calculations in the exploration are currently only able to reference columns in the base table.
Drilling
- Drilling is possible from the published app and within visualization cells in the notebook.
- Drilling is possible when exploring directly on warehouse tables or semantic models.
- Users must have Can explore permissions or higher on a project in order to drill from the published app.
Use drilling to understand the "why" behind the data shown in visualizations. Users can click on a data point (like a bar in a chart), or drag to select multiple data points, and select Drill down. This opens a menu of columns for users to choose from (the columns displayed are those defined in the dataframe that's fed into the visualization). Once a column is selected, the underlying data will be broken out by the selected column in an exploration modal. To go back or "undo" your drill down actions, simply click the Drill up button located in the top right corner of the Explore view.
Users can drill into pivot values in the notebook and the published app. Drilling is not possible in legacy pivot cells. Upgrade your pivot cell to enable drilling.
When using Explore, in addition to using the visualization as a drilling entry point, users can right-click to drill on the grouped or aggregated columns in the table view.
Exploration access
Users with Explorer roles (or higher) can use explorations. Users must have access to a data connection in order to create an exploration that uses the data connection; this includes explorations directly on a table from the data connection, or explorations on a cell in a published app when the cell has an upstream dependency on the data connection.
To explore from a published app, users must have Can explore permissions (or higher) to the project.
If an exploration link is shared with another user, the recipient must have the appropriate role, data connection access, and app permissions (if applicable) listed above in order to view the exploration.
Bookmarking and sharing
Explorations cannot be saved or published, but they can be bookmarked. You can think of bookmarking explorations in the same way you would bookmark a URL in your browser; clicking on a browser bookmark takes you to a website URL. Bookmarking makes it possible to revisit an exploration in the future. You can’t share a browser bookmark with a friend, but you can send them the website URL. Bookmarks work the same way!
To bookmark an exploration, click the bookmark icon in the upper right. This will prompt you to name your bookmark.
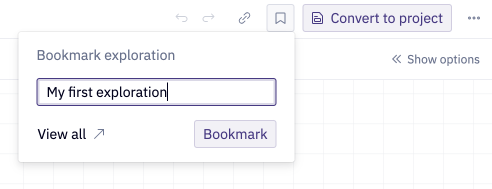
To access all your bookmarked explorations, visit the Explorations tab from the homescreen. If you’ve bookmarked an exploration that stems from a cell in a published app, you can also access that bookmark from the Explore button on that cell.

To share an exploration, simply copy the exploration URL (from your browser or the link icon in the upper right) and send it to the intended recipient. If the recipient has access, they will be able to view it. The exploration does not need to be bookmarked to be shared.
When an exploration (bookmarked or not) link is shared, the exploration is not a collaborative document in the same way that a notebook is. The behavior differs slightly depending on how the link is shared:
- When User A copies an exploration link via the link icon in the upper right and sends it to User B, the link will contain the exact state at the time that the link was copied. Any changes made by User A in the time between copying the link and User B opening the link will not be reflected in the shared exploration. No additional changes made by either User A or User B will be reflected in either user's browser.
- When User A copies an exploration link via the browser URL and sends it to User B, the latest version of the exploration (including any changes that have been made by User A since the link was copied) will be rebuilt in User B's browser. Any changes made by User B will not be reflected in User A's browser. Once the link has been opened by User B, any additional changes made by User A will not be reflected in User A's browser.
Recent explorations
If you forgot to bookmark an exploration and want to pick your work back up where you left off, you can check the Recents tab of the Explorations page to find recently-created, unbookmarked explorations. If you created an exploration and closed your browser tab or navigated away from the page without bookmarking, that exploration state will be stored under Recents. You can think of Recents as your browsing history. Recent explorations are only retained for 14 days, so if the insight is one you'd like to revisit reliably, consider bookmarking the exploration.
Converting to a project
To convert an exploration to a project, click Convert to project in the upper right.
If the exploration was created by exploring from a published app, all necessary upstream cells from the app will be copied into the new project. The final cell in the project will be a visualization cell that holds the exploration you configured prior to converting to a project. If the exploration was created directly on a database table, converting to a project will create a new project with a single visualization cell that holds the exploration you configured prior to converting to a project.
Converting an exploration to a project allows you to do many things:
- Add multiple explorations (or other cells)
- Feed arbitrary dataframes into the exploration
- Publish an app
- Use the more robust version history and permissions systems that come with a project
View Generated SQL
To view the underlying SQL that is generated by Explore, click the 3-dot menu → {} View generated SQL. This will display the compiled query, enabling users to inspect and understand how their analysis is executed.
The generated SQL you see here may be more complex than you'd expect due to the use of CTEs and transformations applied by our underlying logic. These methods are used in order to compile performant queries with accurate results.
Exploring with OAuth data connections
When exploring on a database table from an OAuth data connection, users will always be required to use their own OAuth tokens. If an exploration performed directly on a database table is shared between users, the underlying query will always rerun using each user's token; it will not be possible to view data outputs that were a result of another user's token.
When exploring from an app that has token sharing disabled, users will always be required to use their own OAuth tokens when exploring from the app.
When exploring from an app that has token sharing enabled, exploring from the app will use data that was a result of queries that ran using the shared token. If fresh queries against the database need to be executed when using an exploration, they will never be executed using the shared token; instead, new queries will always be executed using the user's individual token.
How to set up an app for optimal exploring
There are a few ways projects can be fine-tuned such that their apps are optimized for exploring:
- Dataframes that feed into charts and pivots should have plenty of columns. When a user explores from a cell in an app, the columns available to them in the field picker are populated by the columns of the dataframe that feeds into the chart or pivot. Having plenty of columns gives the end users choices when it comes to slicing and dicing the data, instead of being limited to the few columns that were used to configure the chart or pivot.
- Prevent, to the extent possible, aggregation upstream of charts. For example, say that one were to roll up distinct users per day in a dataframe and then chain that into a chart cell. Because distinct users can’t be re-aggregated from daily into weekly or monthly grains, exploring from the chart cell won't allow users to accurately slice-and-dice distinct users along other dimensions. Instead, perform aggregations within chart cells or pivot cells in order to allow workflows like these to be possible.