Develop your notebook
The Notebook view is where you query, transform, visualize, and explore your data.
Develop your analysis
Once you've created your project, you're ready to start developing the Notebook view.
Start with SQL or Python
Hex projects typically begin by adding a SQL cell or Python cell that pulls data from a warehouse connection, CSV file, or API. Add a single cell, or start with a template for a little extra structure.
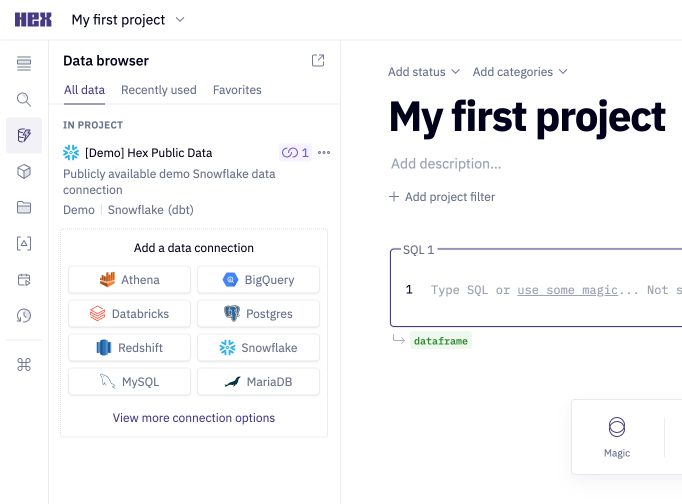
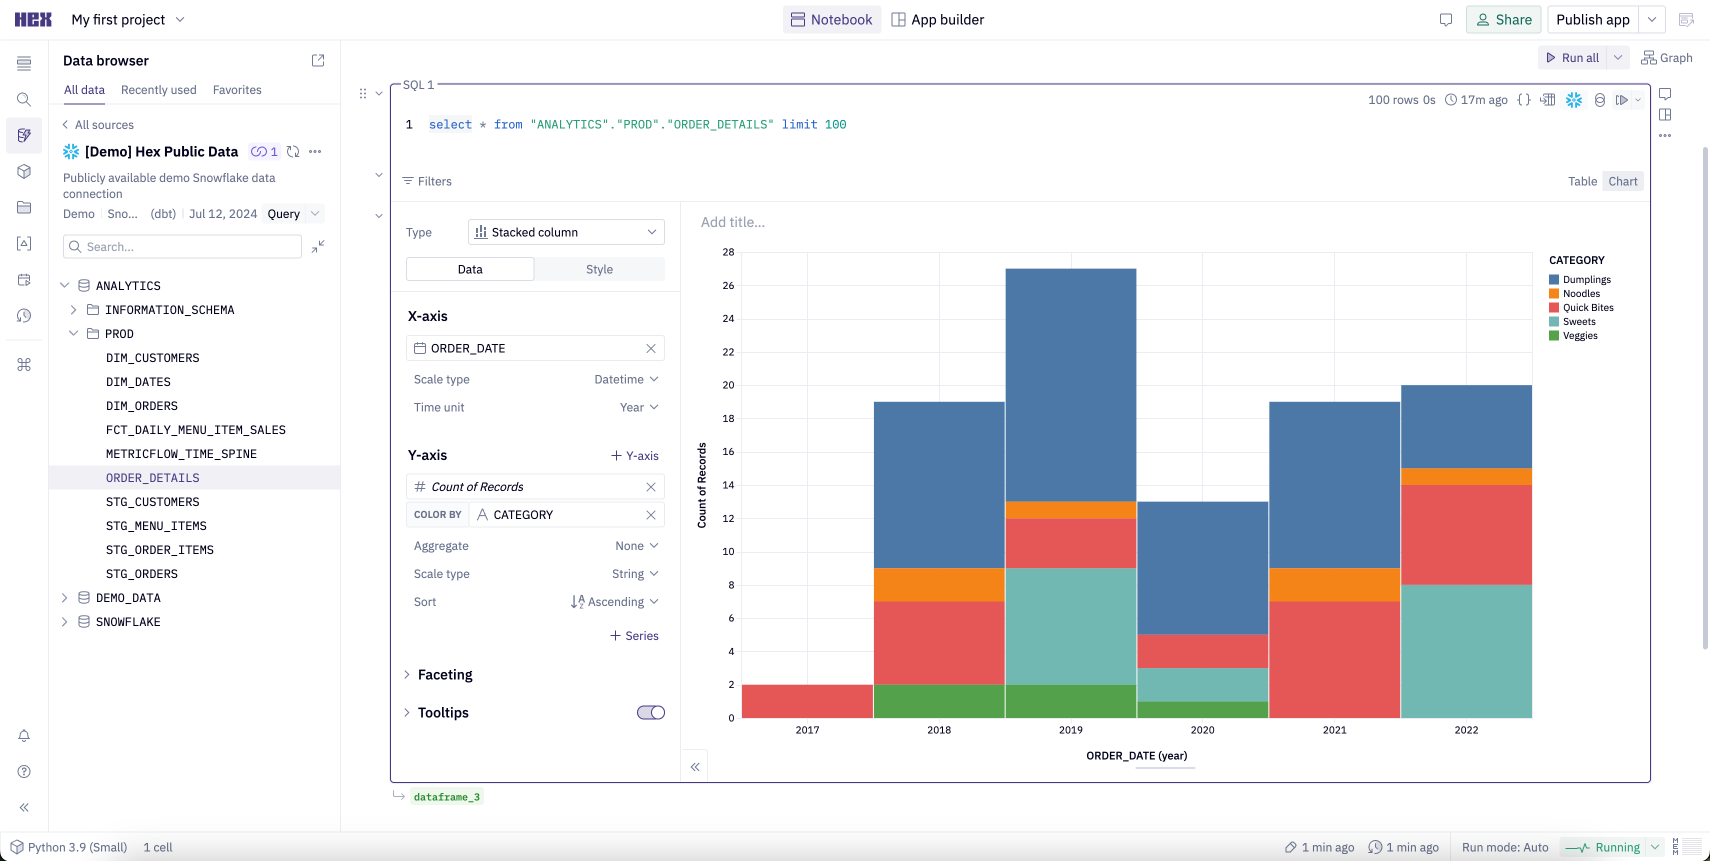
Choose your data source
Browse available data connections in the Data browser sidebar. You can also upload files as a data source from the Files tab in the left sidebar.
Bring data into your project
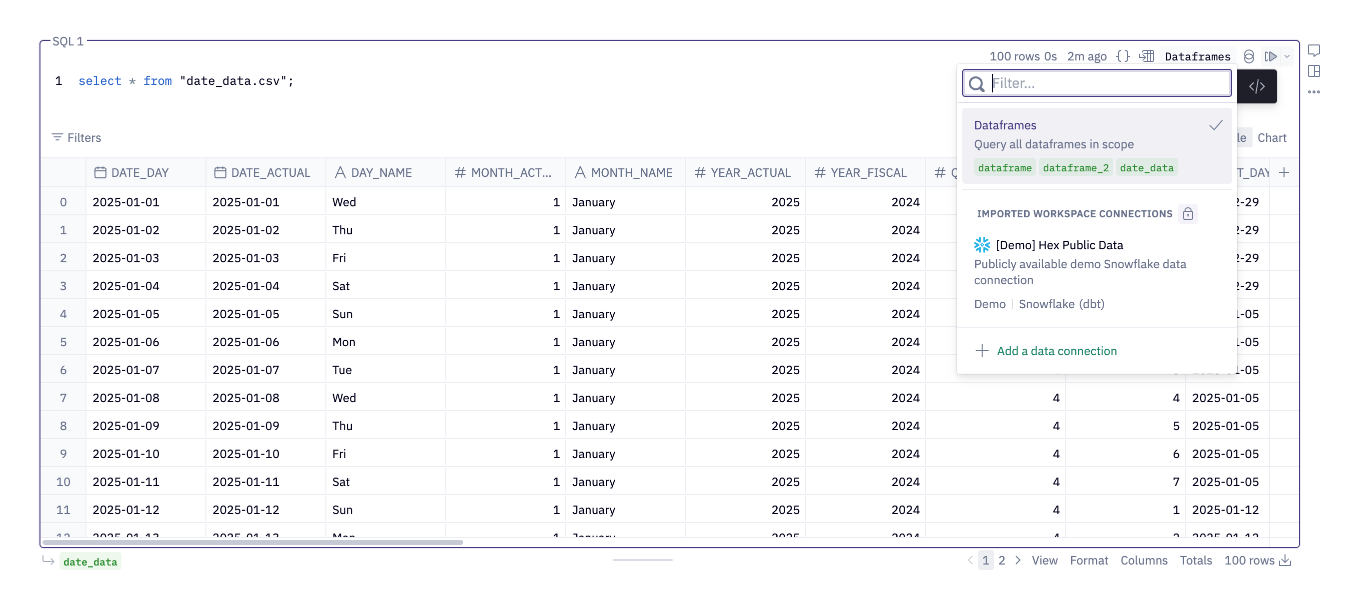
To quickly bring data into your project from a data connection, click on the data connection from the Data sources sidebar, and click Query next to any table name. This will automatically create and run a SQL cell with a select * limited to 100 rows.
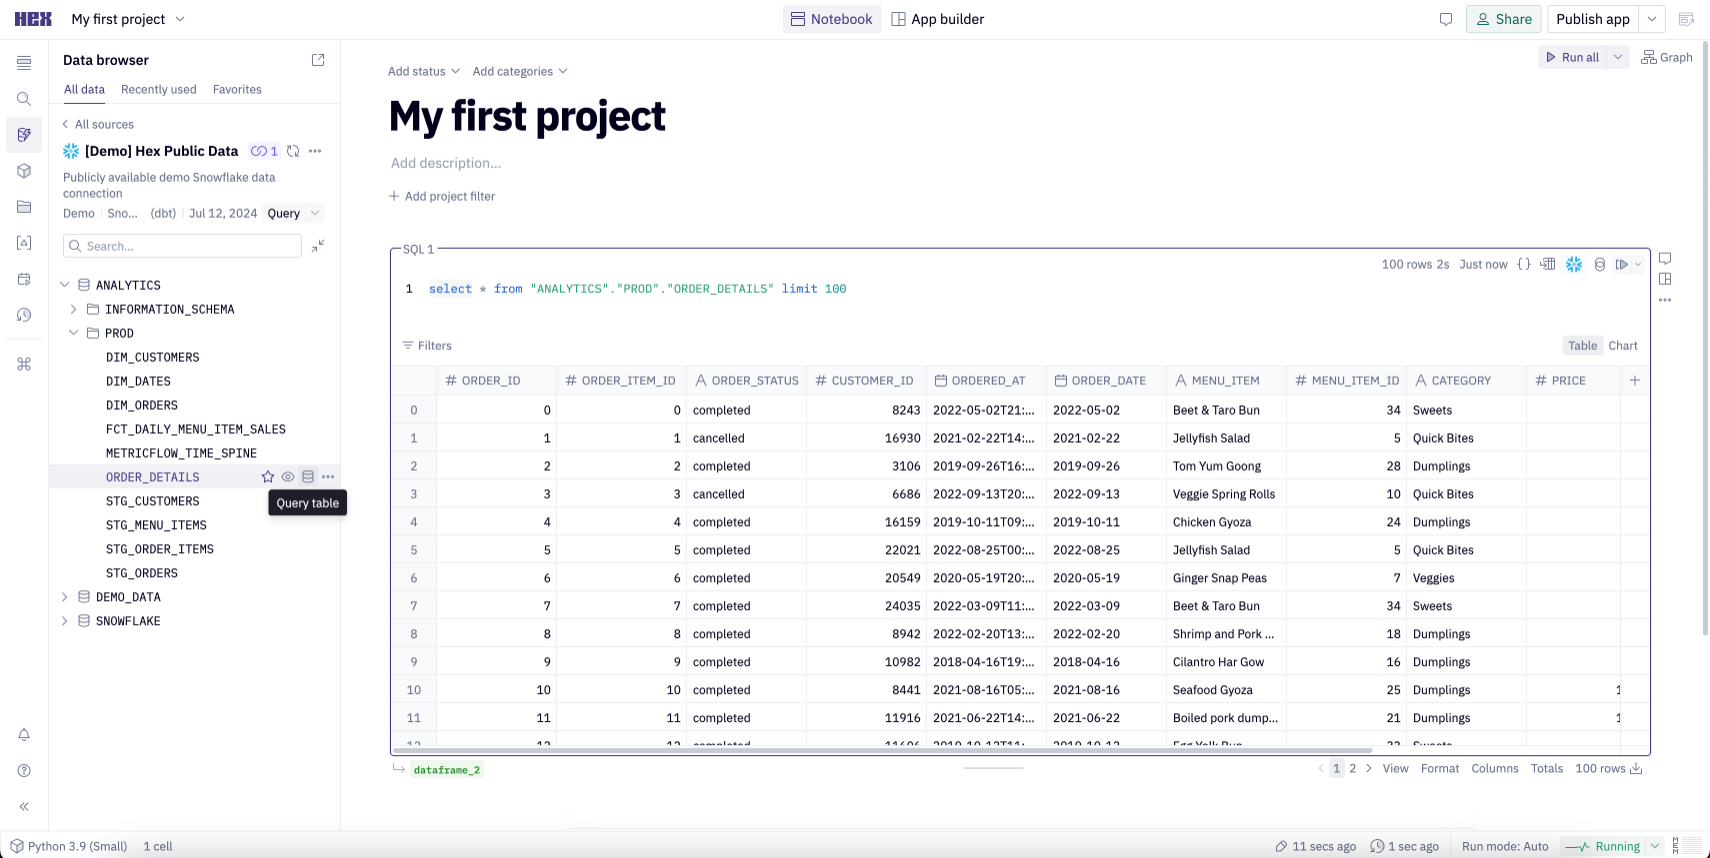
You can also add a SQL cell from the Add cell bar at the bottom of your Notebook view, and write your own query from scratch. Click the Run button in the upper right of the cell (or cmd-return) to run the cell.
If you're querying an uploaded CSV file, you'll need to set your SQL cell's data source dropdown to "dataframes".
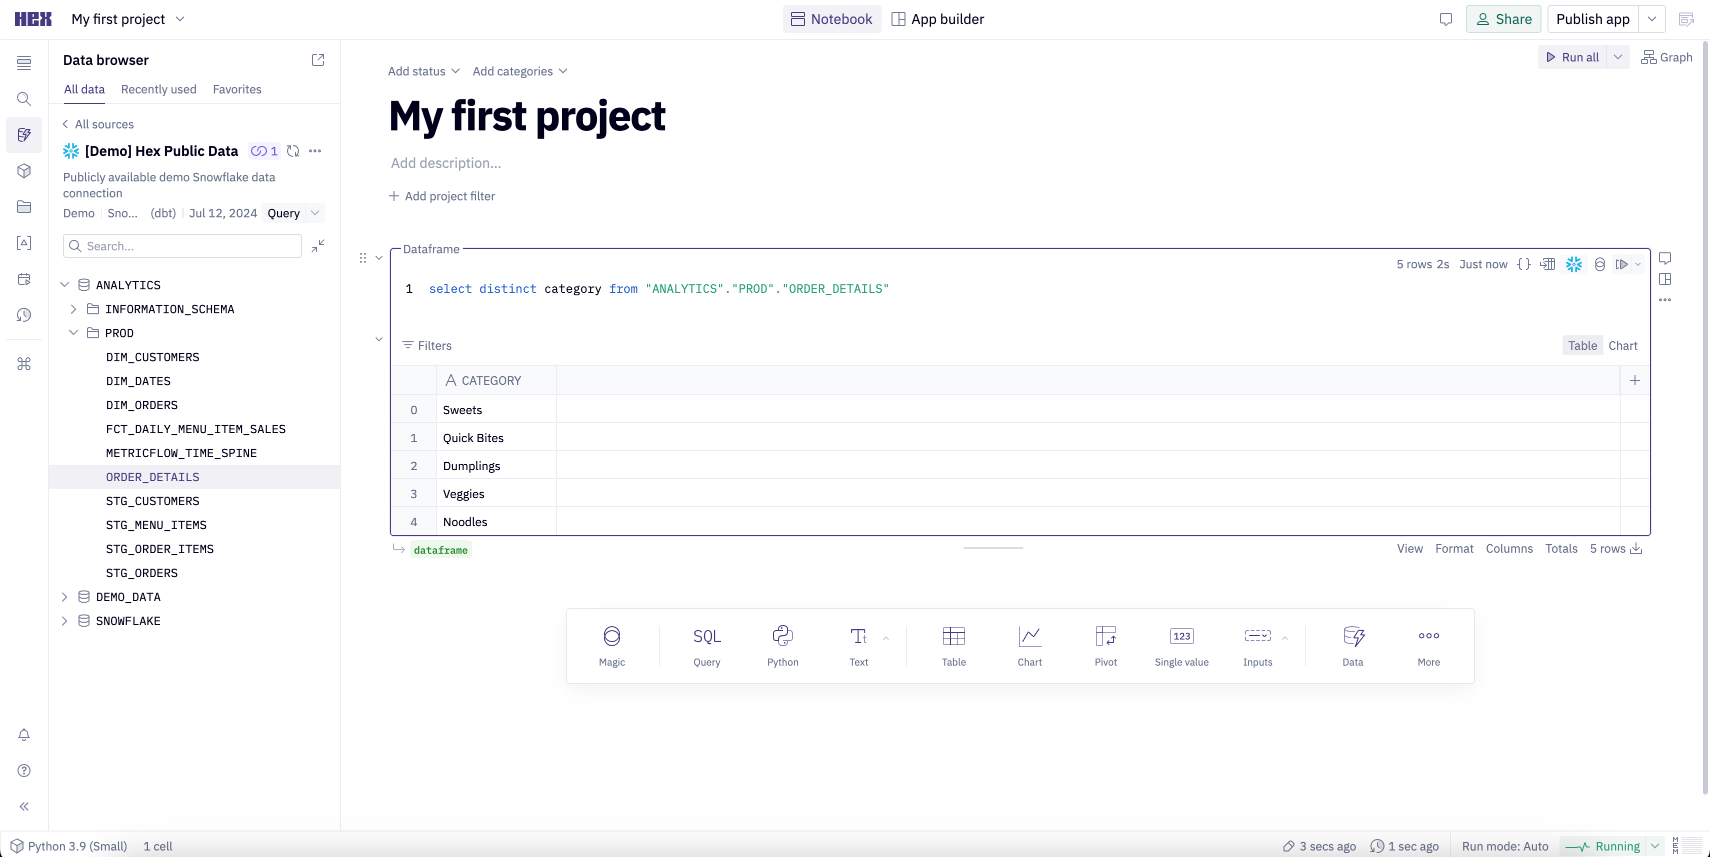
Quickly visualize and transform your data
SQL cells come with built-in display tables and charts, or you can add new cells to visualize and transform your data in multiple ways.
Reference your query result
SQL cell outputs are stored as a dataframe, which is a standard table format with rows and columns. Once created, a dataframe becomes a data source in your project that you can query and reference in downstream cells.
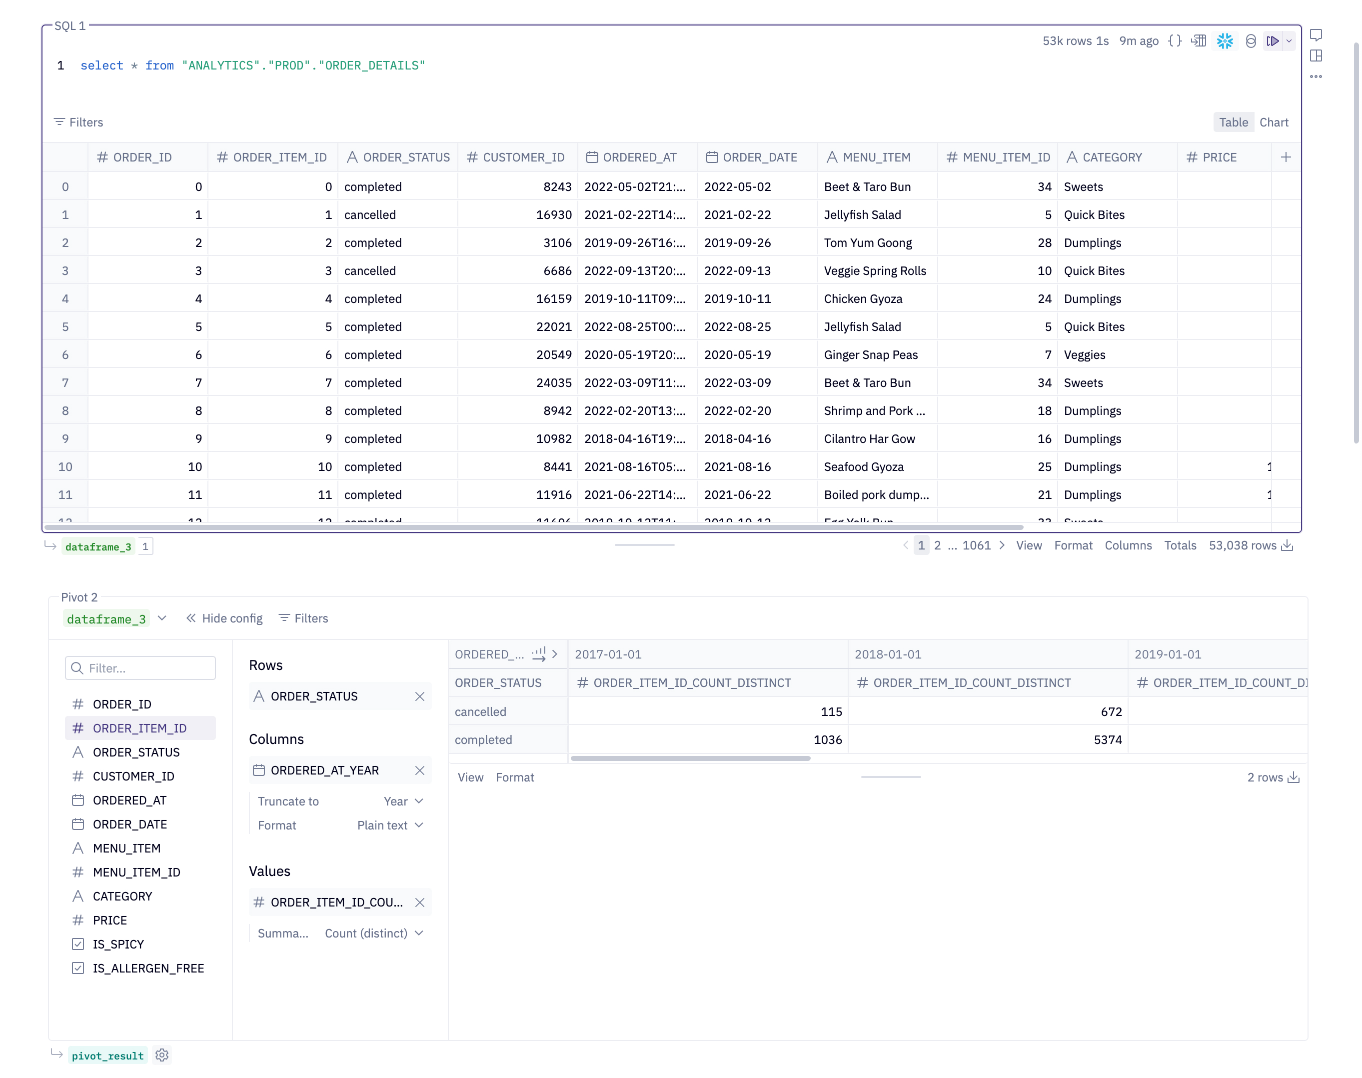
Python cell outputs are similarly stored as variables, including dataframes, which can be referenced in downstream cells.
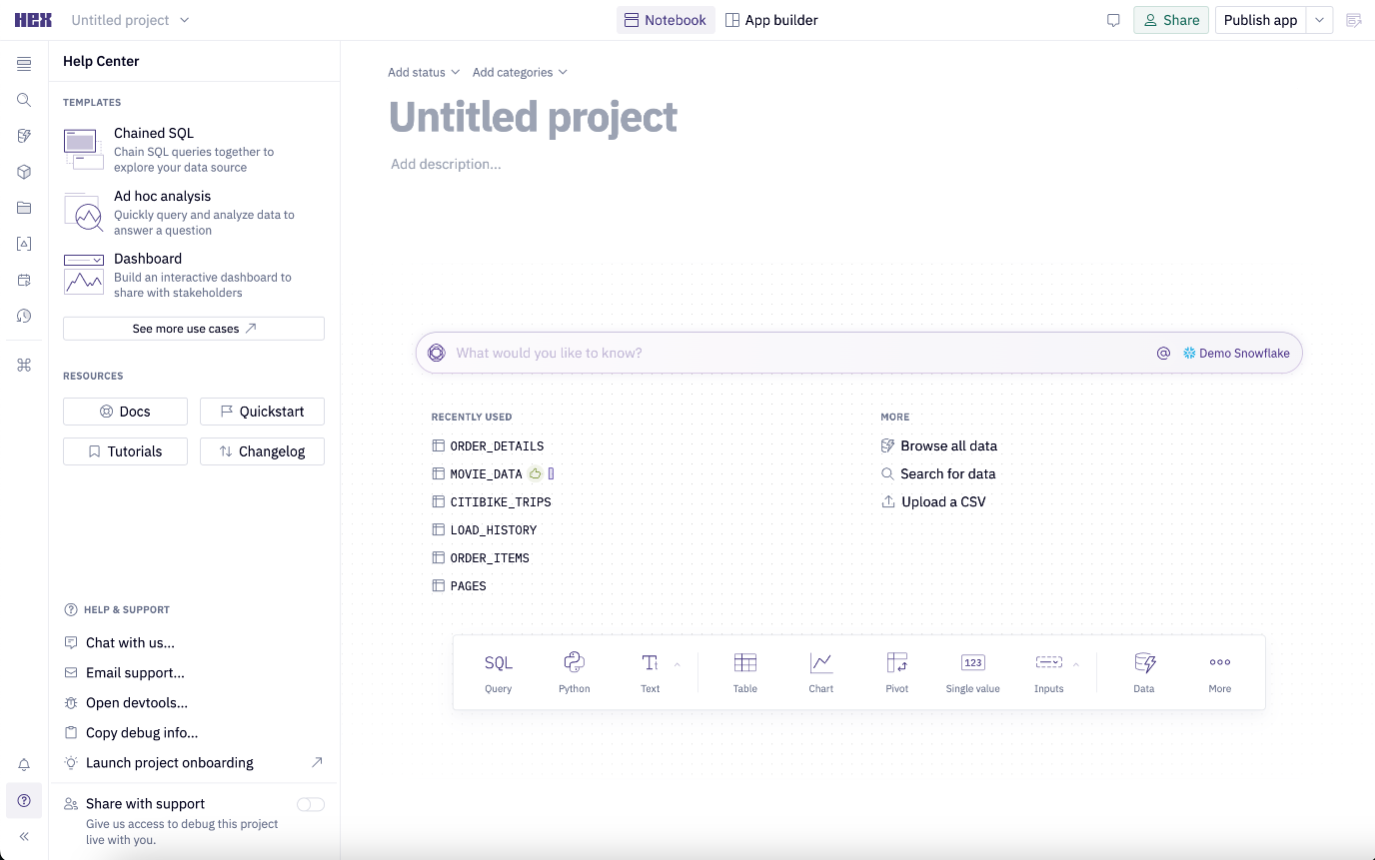
Using the Notebook Agent
The Notebook Agent offers a natural language experience to assist with code generation and exploratory analysis within Hex projects. Within any Hex project, you can access this from the Ask a question modal in the bottom-right corner of the Notebook.