Pivot cells
Use pivot cells to interactively aggregate and pivot your data in a UI-first way.
- Users need Can Edit permissions to create pivot cells.
Pivot cells got a glow-up in August 2025. Pivot cells created before this change are considered legacy and don't have some of the features mentioned in this doc, like pivot totals and drilling. See below for info on how to upgrade legacy pivot cells.
A pivot cell can accept dataframes, semantic models, or warehouse tables as input. Pivots aggregate data based on your configurations, and return a dataframe that can be displayed in an app or used downstream in your notebook.
Using pivot cells
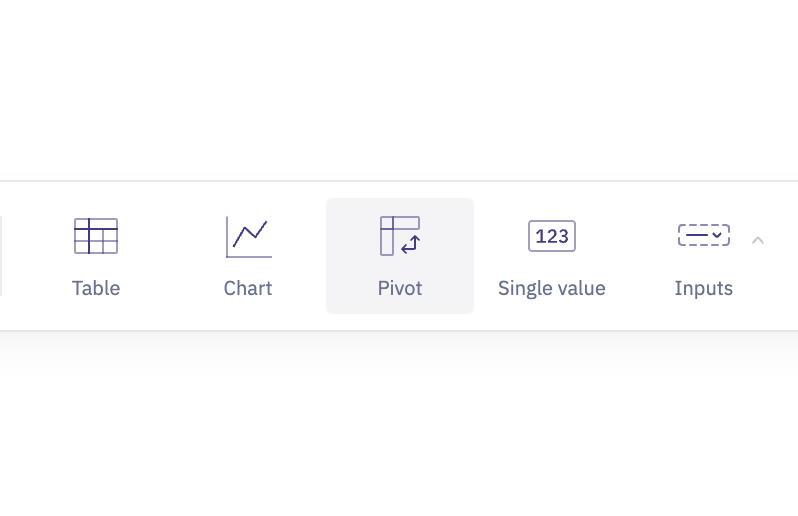
- Create a pivot cell by selecting "Pivot" in the Add cell bar.
-
From the data selector in the upper left of the cell, select a dataframe, semantic model, or warehouse table. All of the fields from the selected data source will appear in the field picker on the left.
-
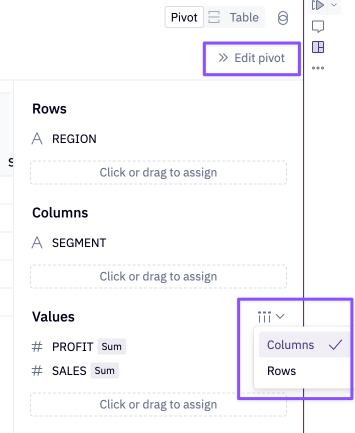
Drag columns from the field picker into the drop zones to render your pivot table.
- Rows: The field(s) you want to aggregate by, rendered vertically.
- Columns: The field(s) you want to aggregated by, rendered horizontally
- Values: The field(s) you want to aggregate. The aggregate type and formatting of the value can be changed per value.
As you configure the cell, the pivot table will update with the results. The resulting pivot table can be added to a published app.
Totals
Row and column totals can be enabled in the Edit pivot panel.
Totals are calculated by aggregating the measure for a given row or column:
- Row totals display the total for each row across all columns
- Column totals display the total for each column across all rows
- Grand totals display the overall total for the entire table
Totals are calculated independently at a broader level, rather than summing the individual values in cells. This means that measure filters are applied separately when calculating totals. Therefore, when applying a measure filter, a row or column total may not exactly match the sum of the values you see in that row or column.
Configuration settings
Click on the column header in the pivot, or use the Edit pivot panel on the right, to change the aggregation type, formatting, truncate time units, and update labels.
To transpose the pivot values and visualize them as rows, use the Edit pivot panel on the and click the icon next to the values, as shown in the screenshot below. This config option only appears when multiple values are included in the pivot.
Row and column totals can be toggled on or off in the Edit pivot panel. Conditional formatting on pivot values can also be applied in the Edit pivot panel.
Output dataframes
Click Create output below the pivot cell to generate a dataframe that can be referenced downstream in the project.
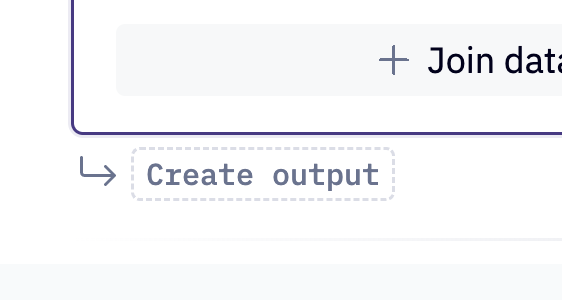
The returned dataframe will hold the grouped, aggregated data represented in the pivot.
Calculations
Click the + next to the Dimension or Measure lists in the field picker to add custom calculations.
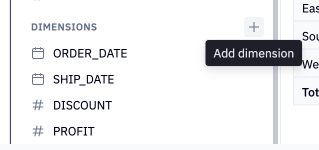
This will open the calculation editor and prompt you to define a custom field. Read more about calculations here.
Drilling and viewing data
Click on any pivot value to view underlying data or drill down. This is possible by users with Can Edit access in a notebook, and by users with Can Explore access in a published app.
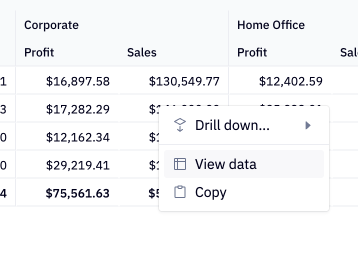
Read more about drilling here and viewing underlying data here.
Legacy pivots
We upgraded our pivot cell in August 2025. Pivot cells created before this upgrade are considered legacy.
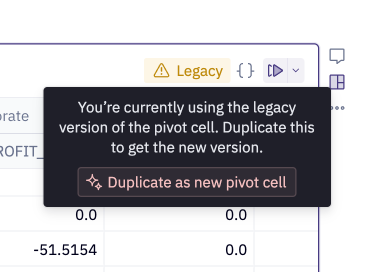
Pivot cells created before August 2025 will still run, but are considered legacy and have a "Legacy" tag that is visible in the notebook.
Upgrade legacy pivot cells
It's encouraged to upgrade legacy pivot cells to take advantage of new features that only exist in the new cell, like pivot totals and drilling. To do so, hover over the "Legacy" tag to see an option to duplicate the legacy cell as a new pivot cell.
The remainder of the doc describes legacy behavior specific to the legacy pivot cell.
[Legacy] Using pivot objects in downstream cells
Legacy pivot cells returned a custom pivot object (HexPivotTable), named pivot_result by default. The custom pivot object is not a dataframe itself, rather it contains two different dataframe representations of the data, .pivoted and .aggregated.
-
HexPivotTable.pivotedreturns the pivoted object as a dataframe that uses the same indexing and pivoting that is rendered in your original pivot cell. -
HexPivotTable.aggregatedreturns the aggregated data without any pivoting. For those familiar with SQL, this is the result of writing a statement that groups by all the fields rendered as rows and columns, before the data is pivoted.