Table display cells
Visualize, format, and filter tabular data with Table display cells.
- Users will need Can Edit permissions to create and configure Table display cells.
- Users with Can View App permissions and higher can add new filters on Table display cells in published Apps.
Table display cells are a fast and easy way to visualize, filter, and format tabular data without writing any code. Simply choose a dataframe and use the Table display settings to apply any filters, change the data format of any column, hide any column, wrap text, and more.
Add a Table display cell
From the Add cells menu in your Notebook view, select Table.

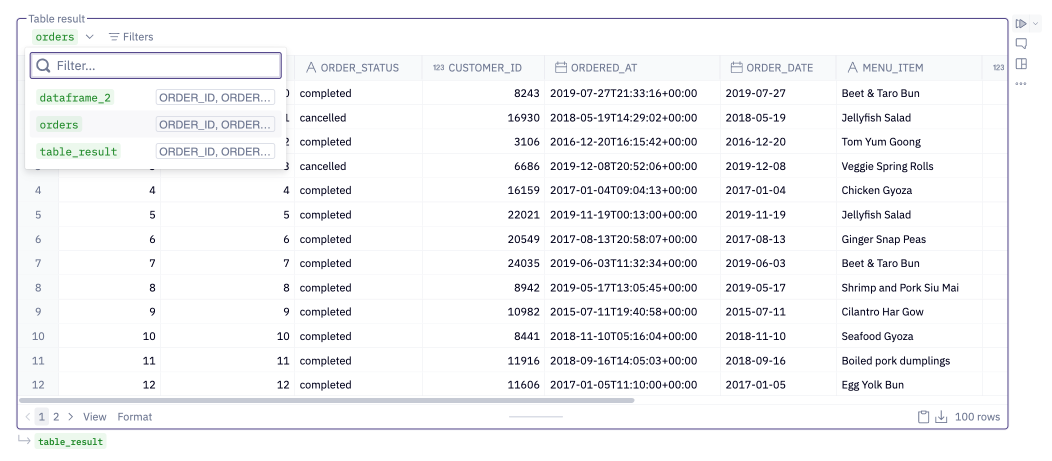
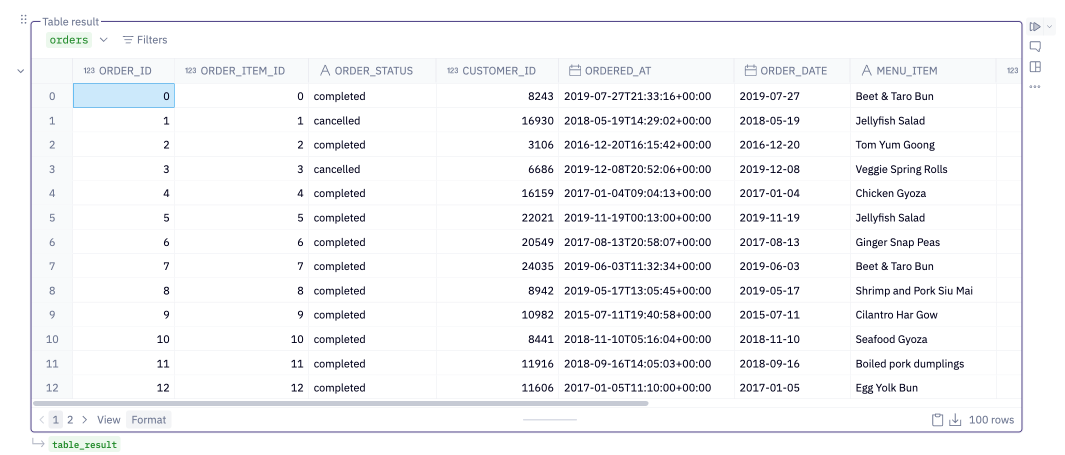
Use the Data source dropdown at the top of the Table display cell to select the dataframe to display.
Format your Table display cell
All of the filter and formatting features available in Table display cells are also available in the Display mode for a SQL cell.
Table view formatting
From the View menu in the bottom right of your Table display cell you can see different options for configuring the view of your table.
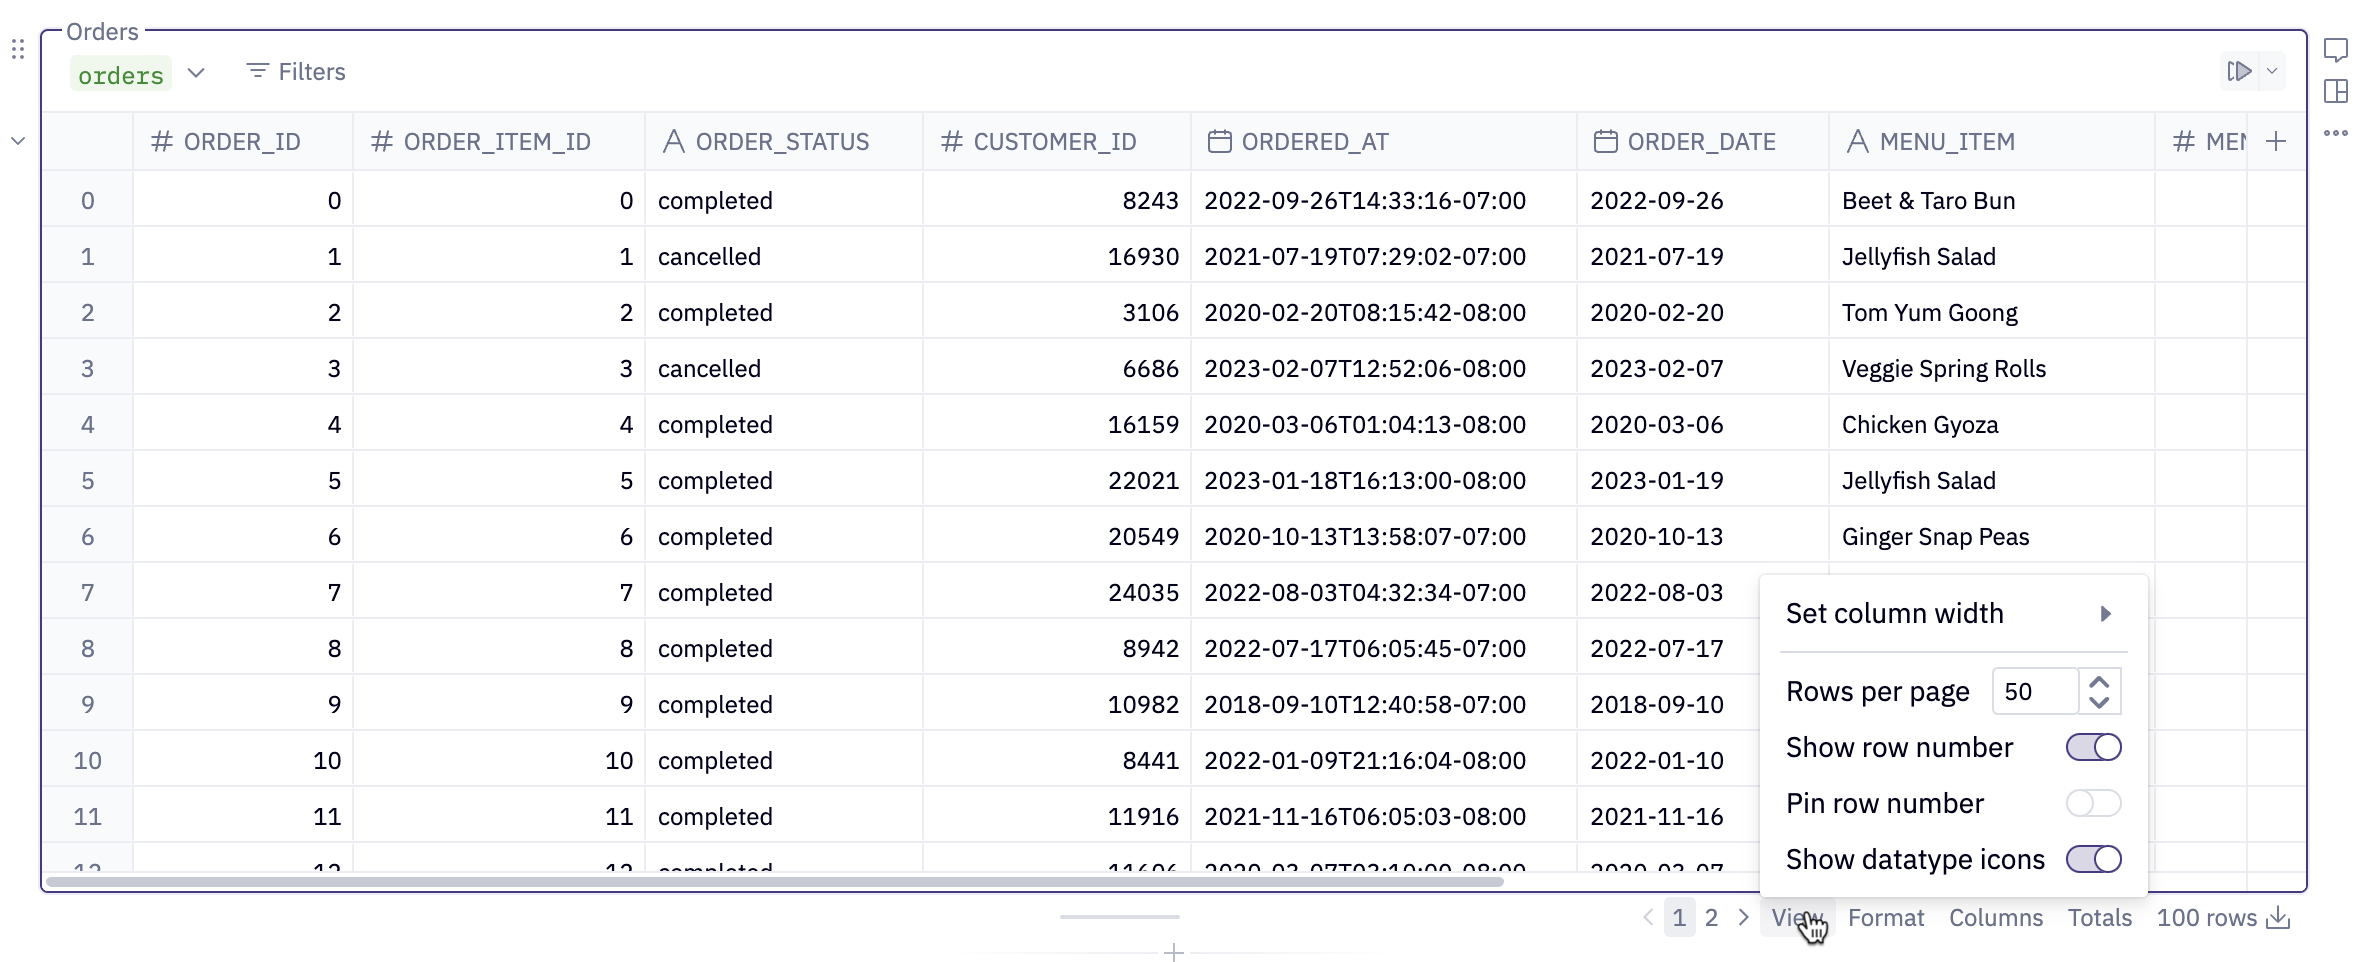
- Rows per page: Specify the number of rows to display per page.
- Show row number: Choose whether to show or hide the row number.
- Show datatype icons: Choose whether to display an icon in the column header indicating each column's datatype.
In Table Display cells, only the rows of the current page are loaded into memory. Consider this when deciding how many rows per page to display, as changing the page requires the cell to rerun in order to select new rows for viewing.
Column formatting
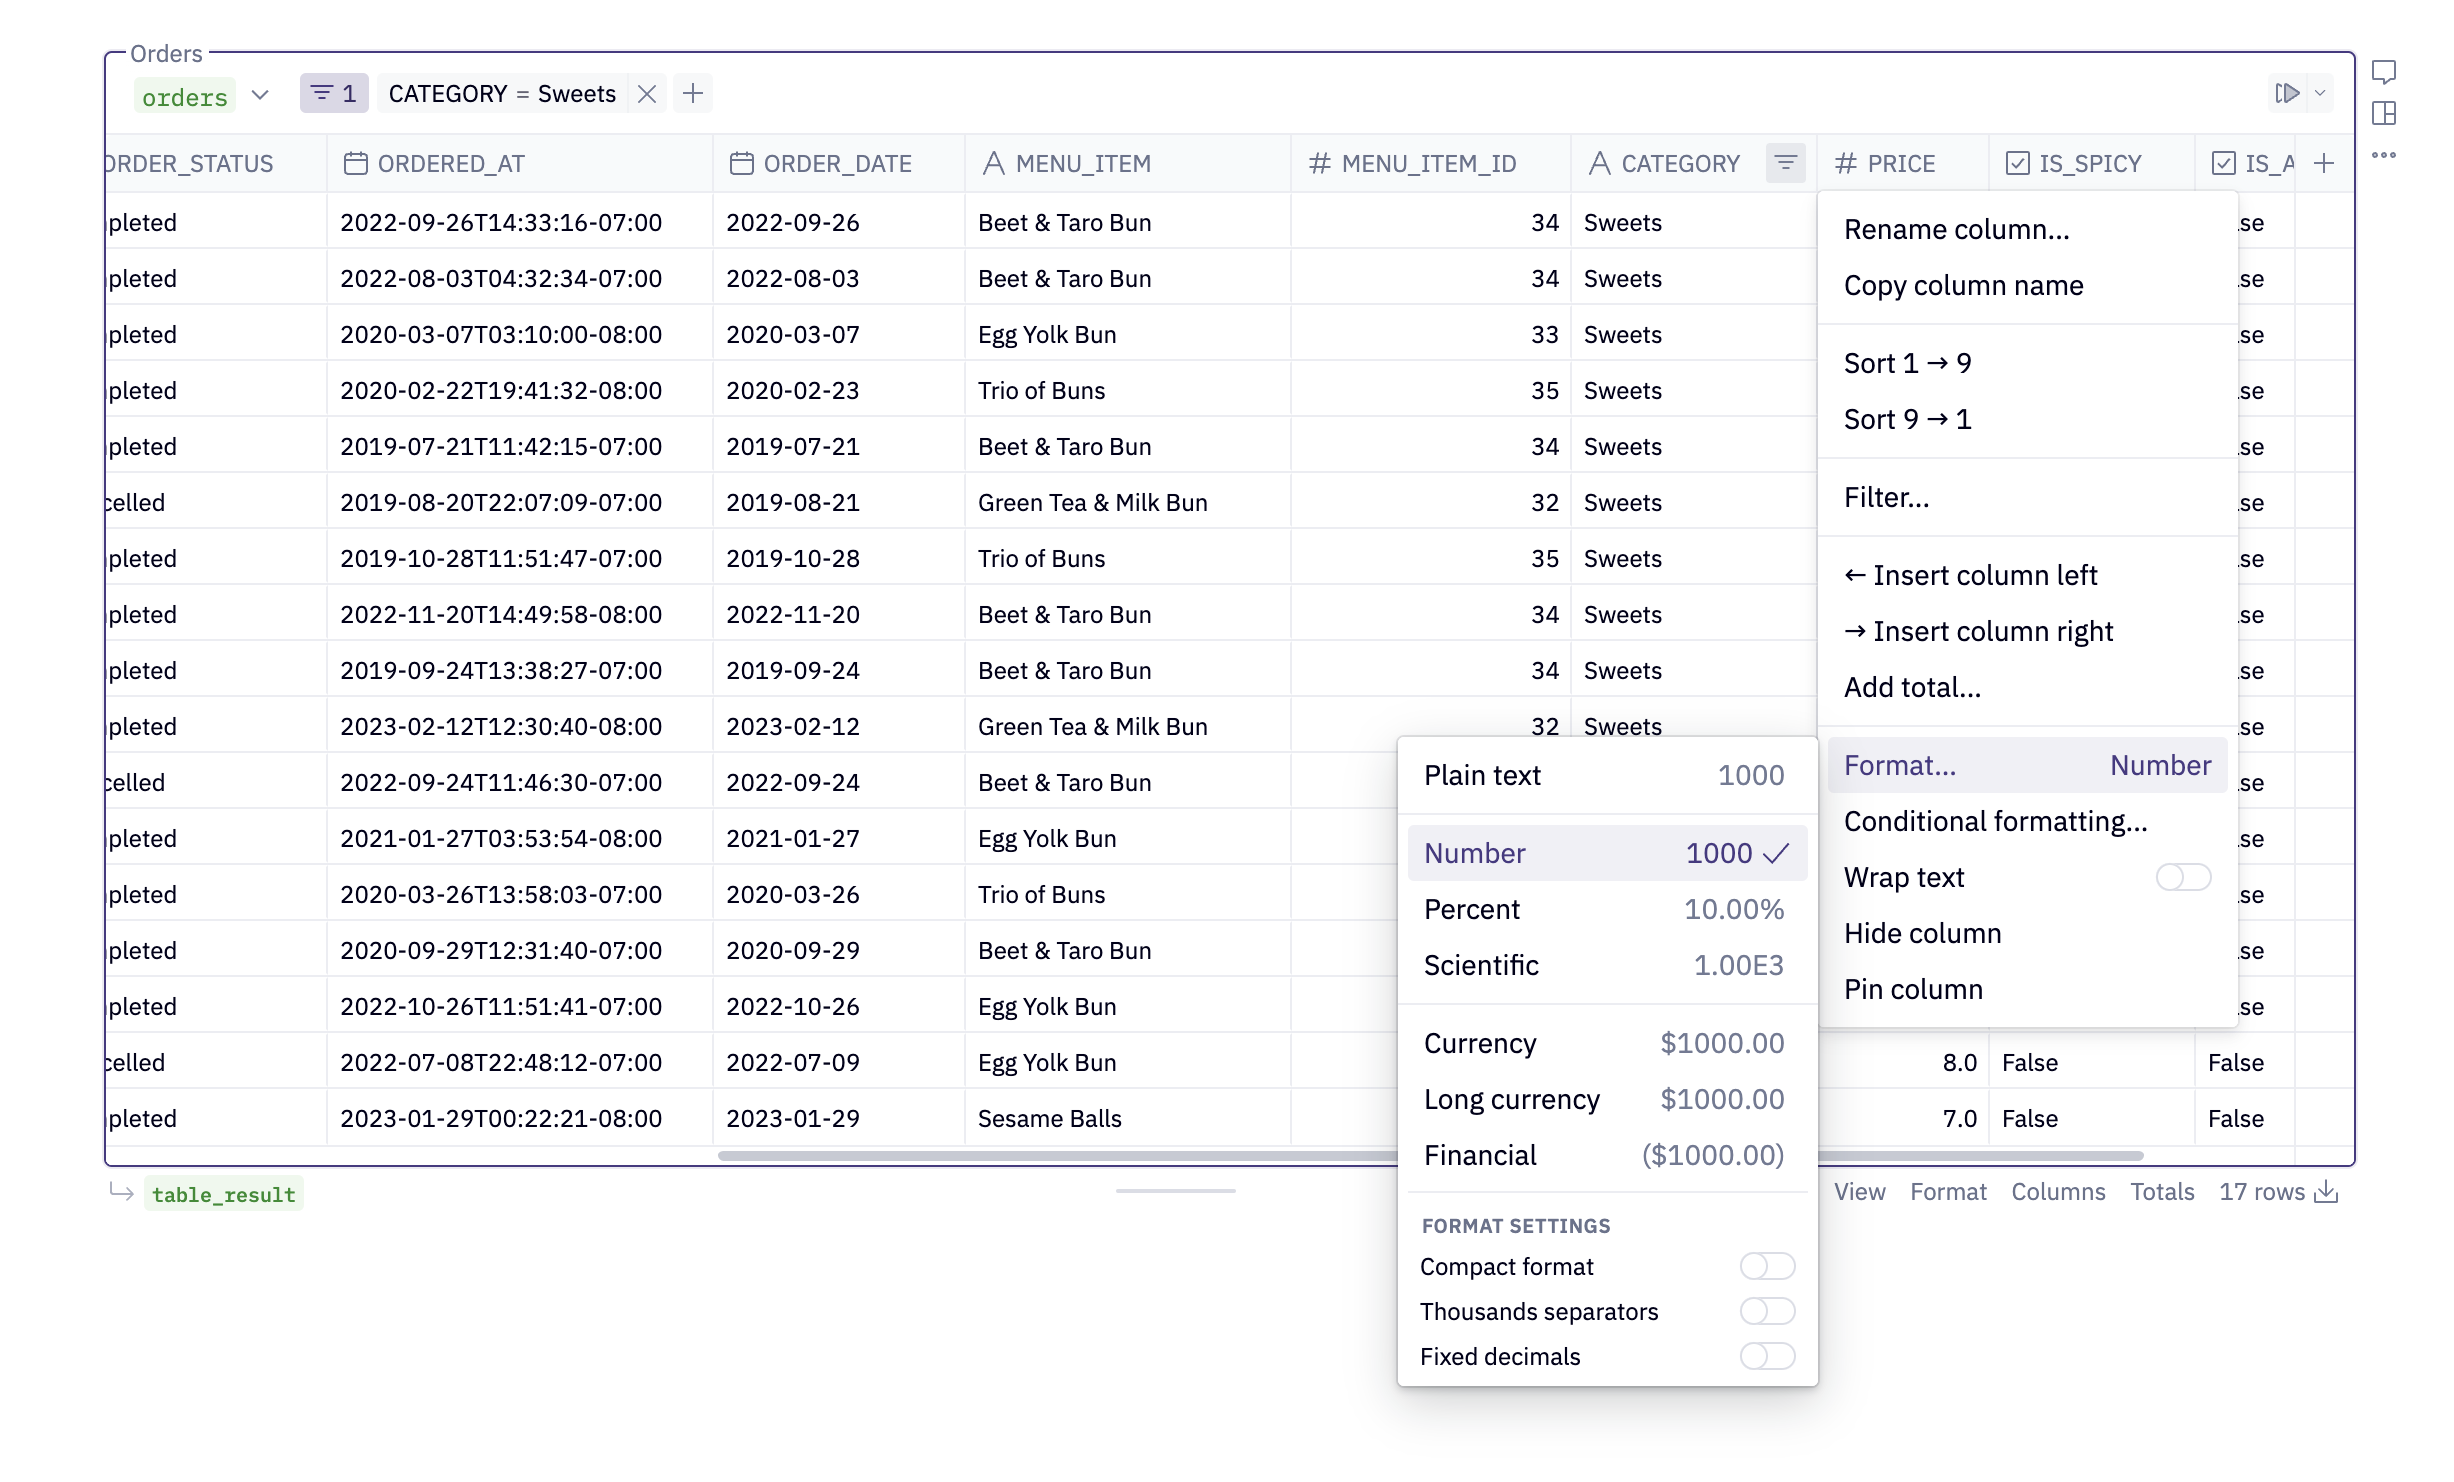
Click the header of a column to can see different options for formatting the values in the column. Column formatting is handy for quickly reformatting a number as a percent, currency, or scientific notation, and adjusting the number of decimals.
Changes made to formatting and column names are not persisted to the underlying dataframe, so will not be passed through to any downstream references of the dataframe.
- Rename: Change the column display name.
- Sort ascending and sort descending: Order rows by column values.
- Filter: Shortcut to create a new Table display cell filter.
- Format: Change the format of the column values. Available formats include:
- String columns
- Automatic
- Plain text
- URL
- Numeric columns
- Plain text
- Number
- Percent
- Currency
- Long currency
- Financial
- Decimal settings
- Date / time columns
- Plain text
- Date
- Long date
- Time
- Date & time
- String columns
- Hide column: Hide the column from the table display.
- Wrap text: Enable or disable text wrapping for a column.
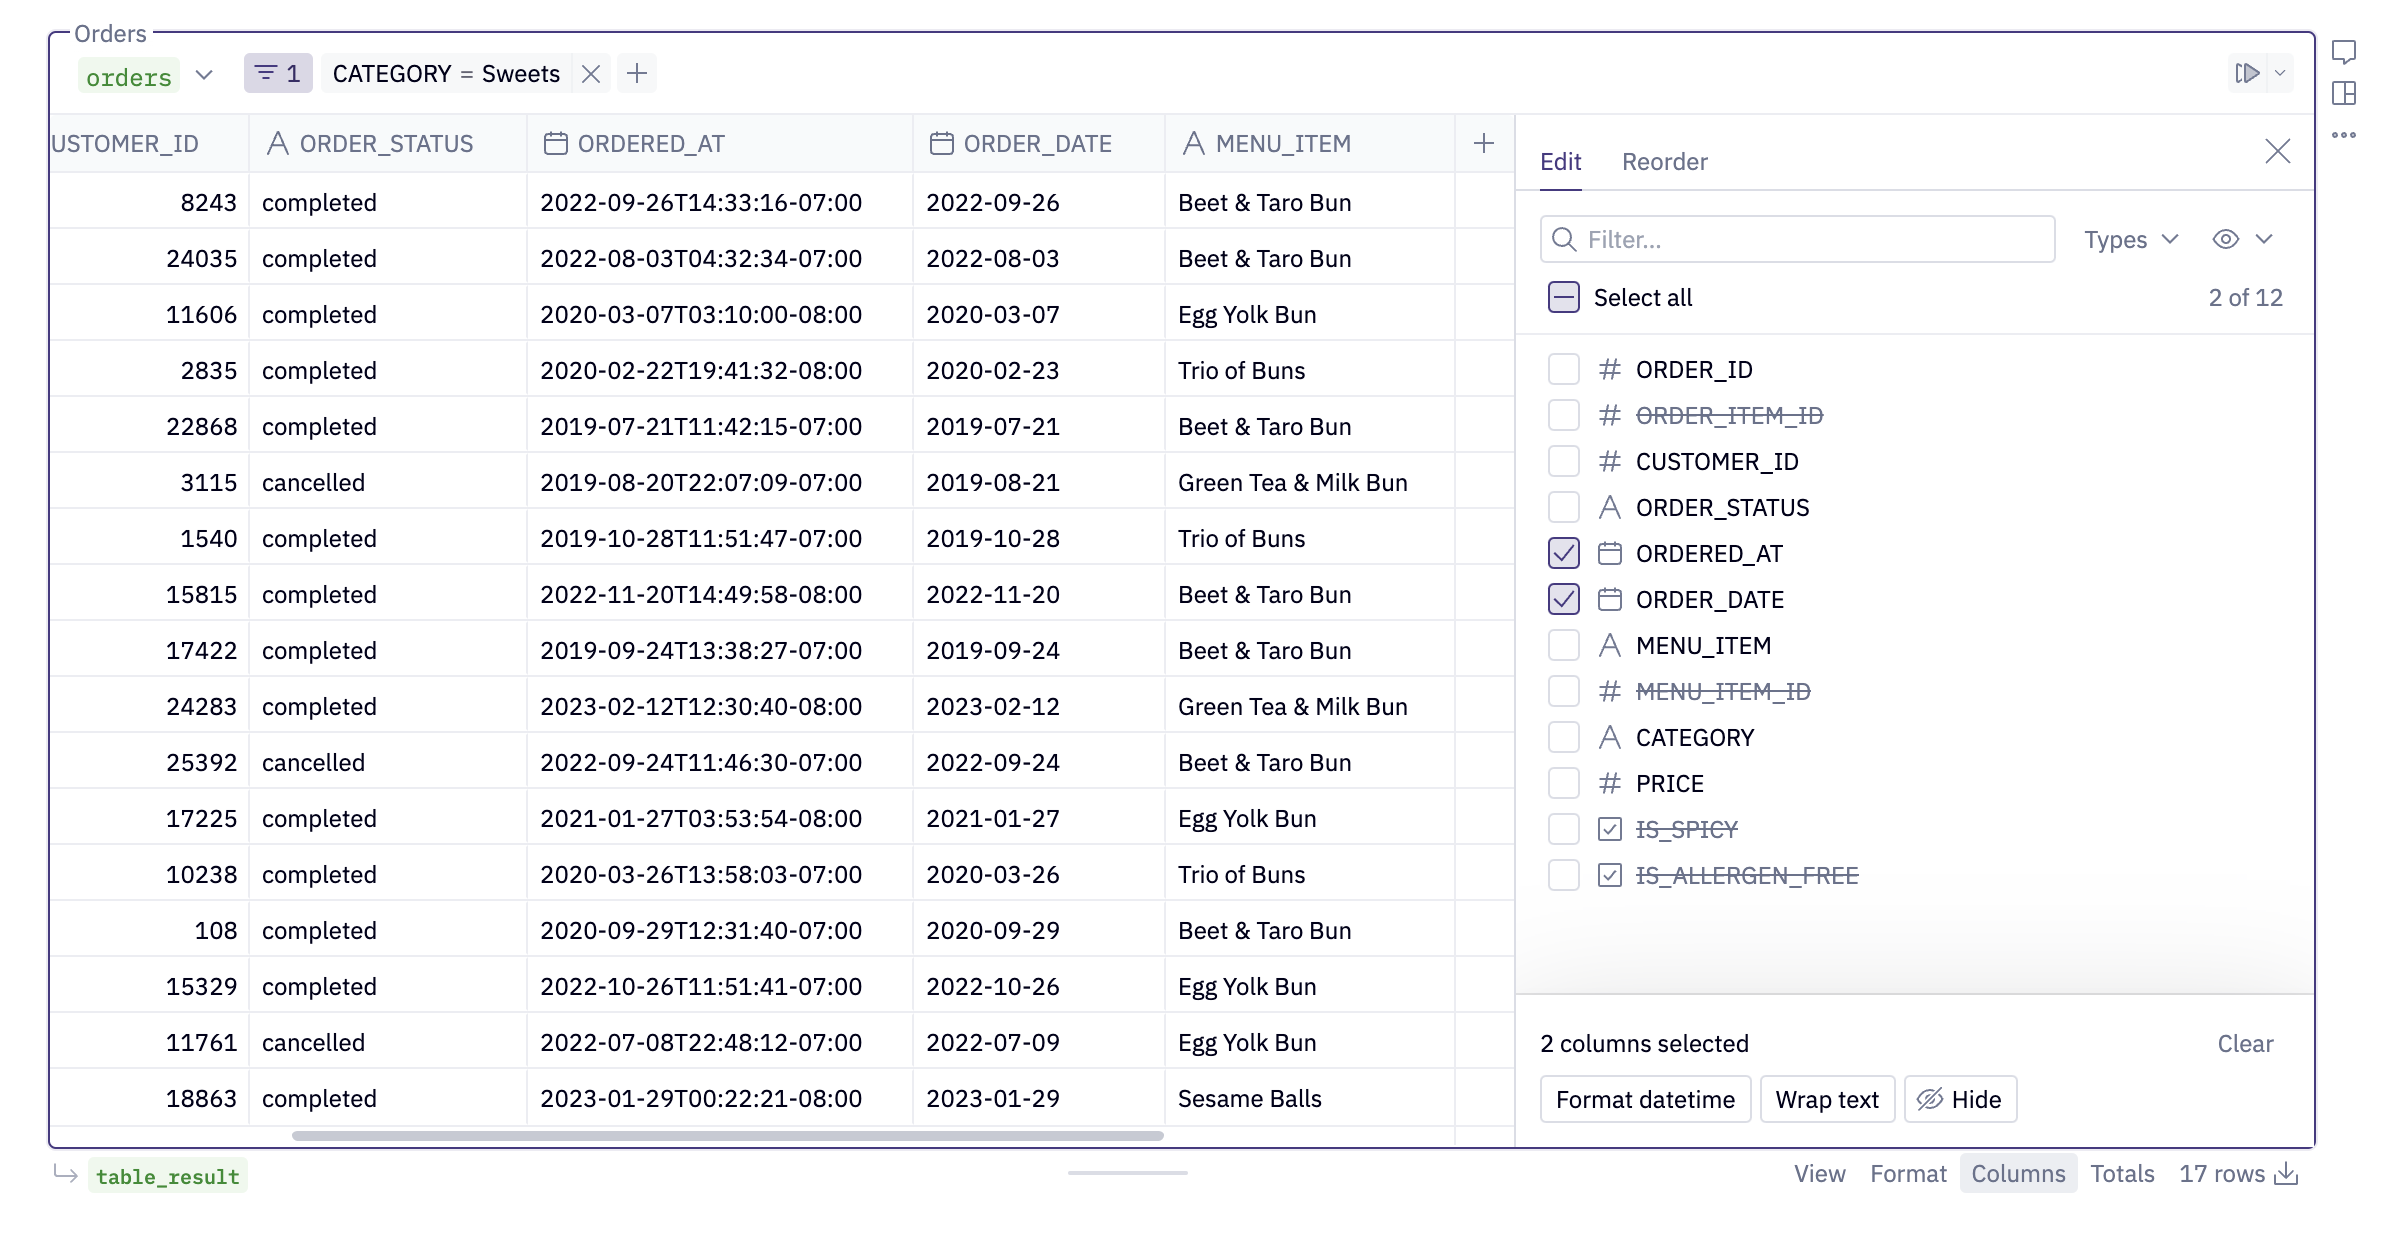
Bulk editing
You can also bulk edit columns from the Columns menu in the bottom right of a table. In the Edit tab, search or filter, then multi-select columns to format, wrap, and hide columns in bulk.
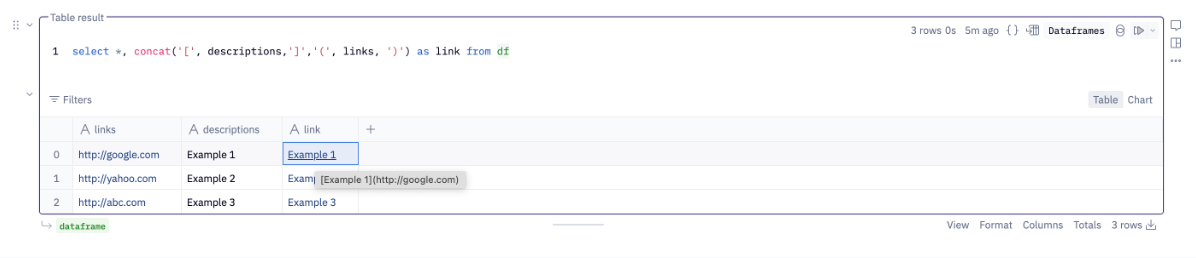
Hyperlink formatting
Markdown-style links like [text](url) in a column will automatically display as a hyperlink. This is applied as the Automatic format in the column's settings. It is possible to swap between format types in the column settings.
Pin and reorder columns
Drag and drop a column header to reorder the way columns are displayed in the table. To pin a column, click on the column header and select from the menu. Pinning and reordering the columns in a table will not mutate the underlying dataframe.
Alternatively, click the Columns option at the bottom of a table and the Reorder tab to reorder or pin columns in a vertical panel (column pinning is not supported in Chart cells or Pivot cells).
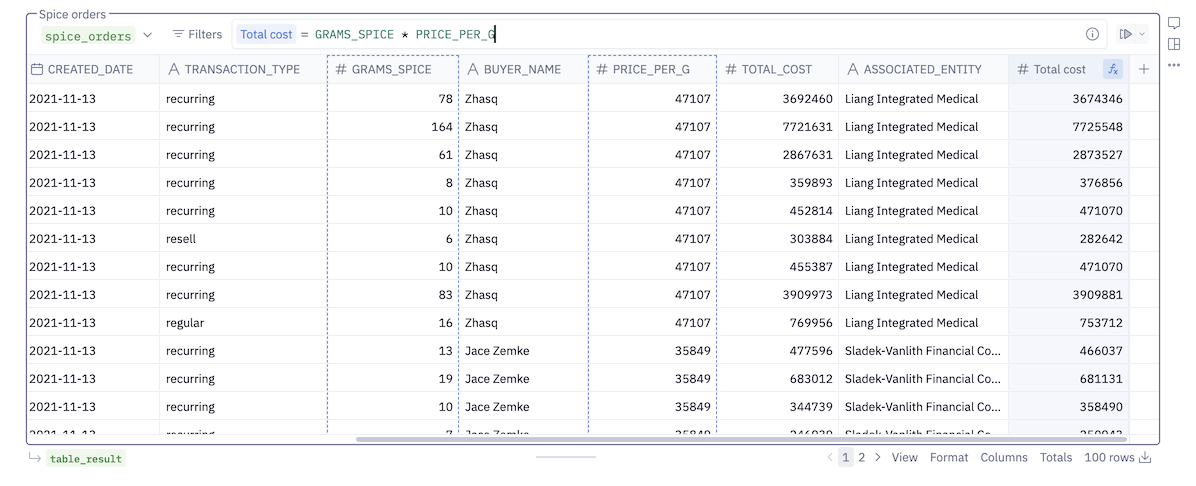
Calculations
Calculations on data from SQL Servers are not supported in table cells.
Add columns defined by custom spreadsheet-style formulas. See the docs on Calculations for more details.
Totals
Use totals to calculate an aggregate of a given column. Totals will be displayed as a final row in your table display. You can enable totals a few different ways:
- Click on the header of a column, then click Aggregate. This will pull up a list of aggregates to choose from.
- Click on View in the lower right of the table display, then toggle on Show totals, which will add the totals bar to the table. Hover over the total bar for a column and click Calculate to choose an aggregate.
Totals are calculated over the entire results set, not just what's currently visible in the table.
Conditional formatting
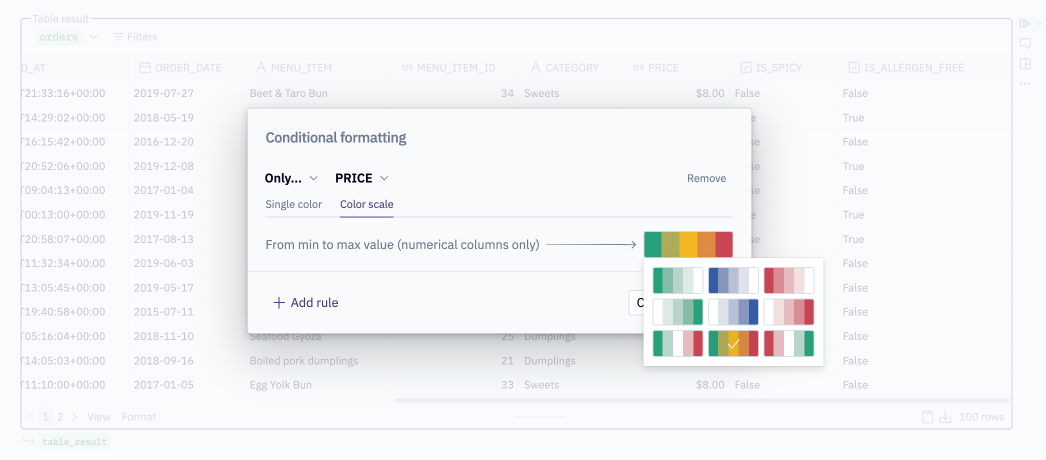
Conditional formatting lets you define rules to determine how specific table cells should be formatted based on their value.
Add a conditional formatting rule
To add conditional formatting to a column or columns in your Table display cell, open the Format dialogue from the bottom right of the cell.
The first time you open the Format dialogue for a Table display cell, you'll be prompted to configure your first rule. You can add as many rules as you like by clicking +Add rule.
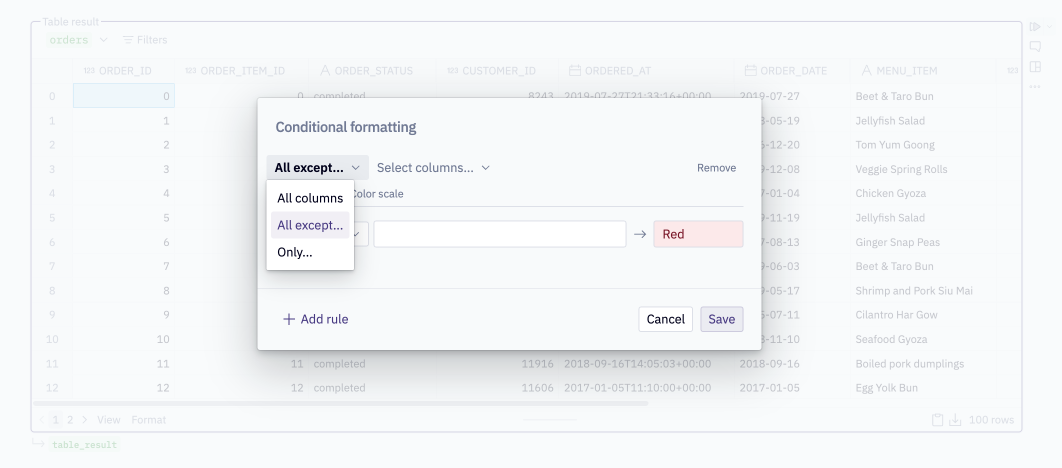
Conditional formatting rules can be applied to:
- All columns
- All columns except those you specify
- Only columns you specify
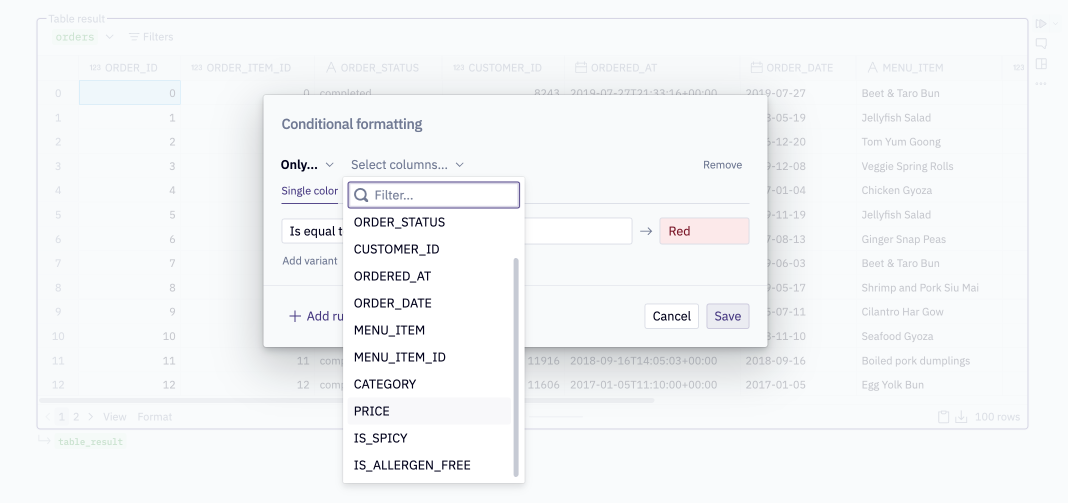
Different column data type support different comparison operators in a rule:
- All data types: Is equal to, Is not equal to, Always
- Text: Text contains, Text does not contain
- Number: Greater than, Greater than or equal to, Less than, Less than or equal to
- Date: Day is, Day is before, Day is after
- Boolean: Is false, Is true
Add a rule variant
Each conditional formatting rule can have several "variants". Variants function similarly to a CASE statement in SQL or an if statement in Python. They allow you to combine multiple comparison operator statements into one rule to determine the formatting of a value in the specified column(s).
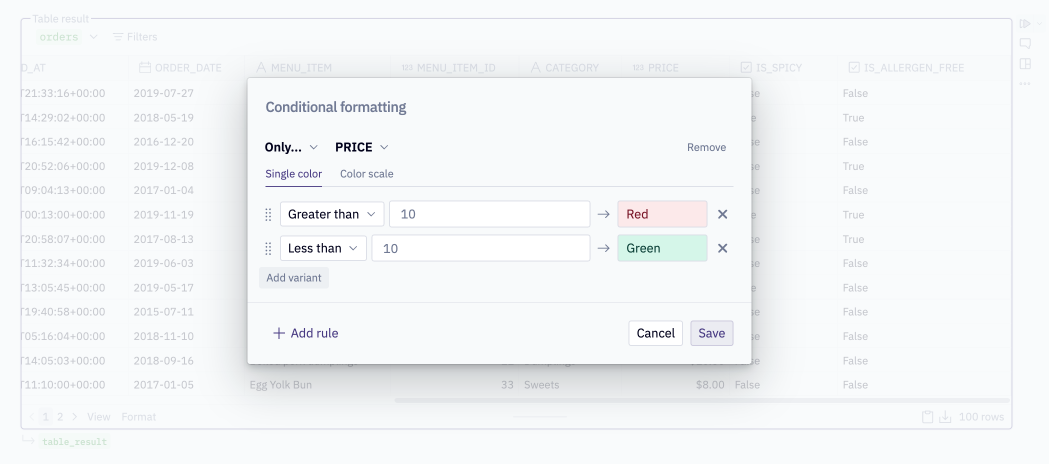
Single color vs. Color scale formatting
Conditional formatting rules can be configured to assign a single color to a table cell based on the rule, or to assign each cell a color on a scale based on the min and max values in the column.
Single color formatting allows for coloring cells either Green, Yellow, Orange, or Red.
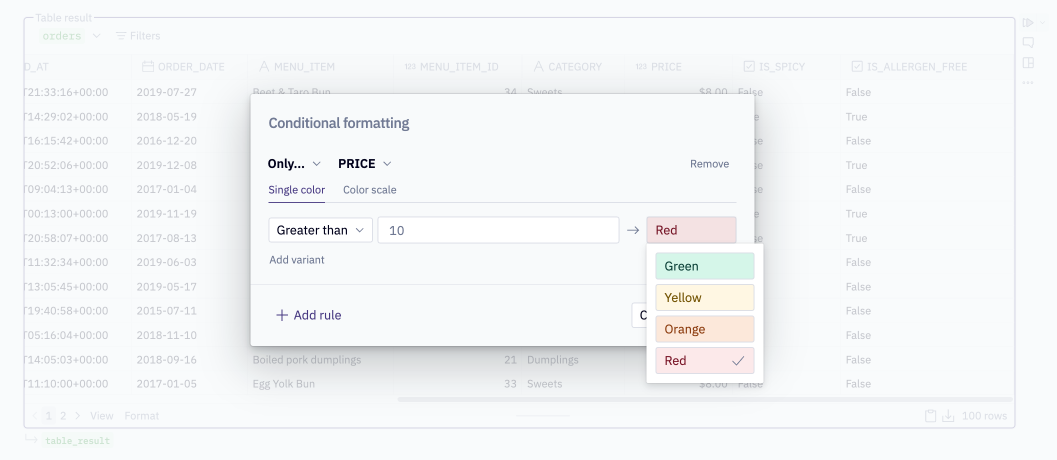
Color scale formatting offers 9 preset options.
Filter your Table display cell
Table Display cells can filter data with a condition-based UI similar to a spreadsheet.
Filters added to a Table display cell from the Notebook view are applied to the returned dataframe. Filters added by someone viewing the published App are not applied to the returned dataframe.
Add a filter
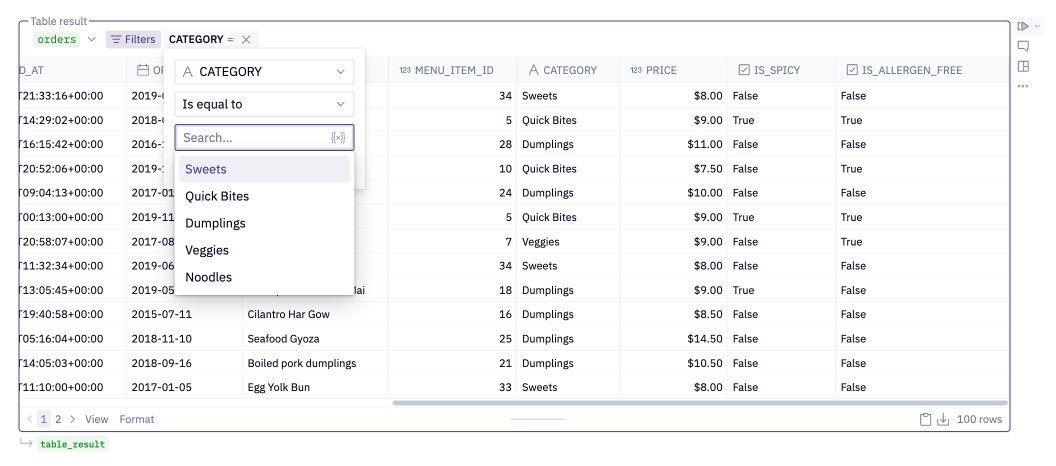
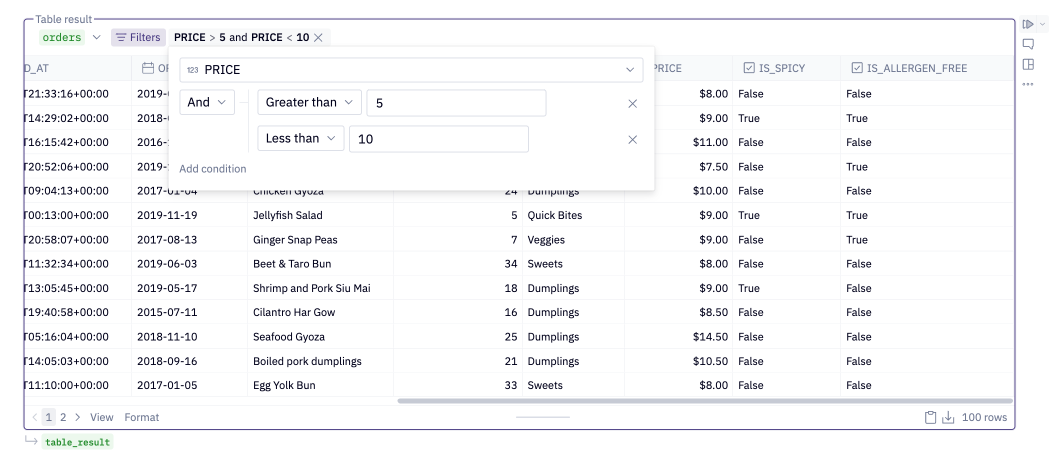
From the Filters menu at the top of your Table display cell, select a column, comparison operator, and value to add a new filter.
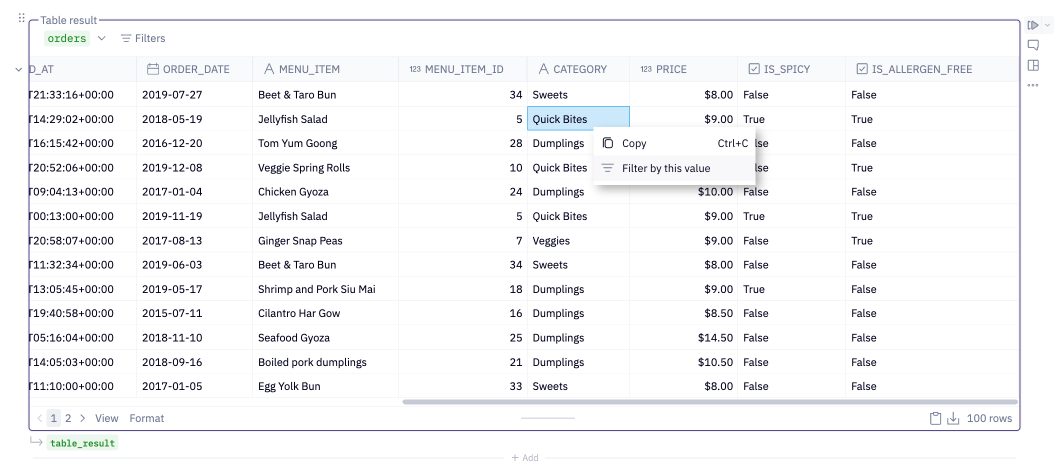
You can also right-click on a table value in order to filter the column by that value.
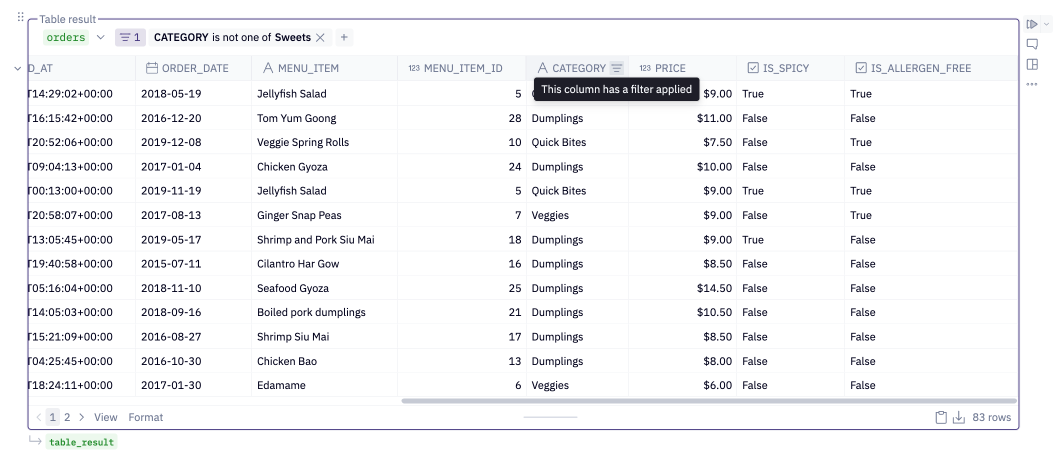
Columns with a filter applied will be marked with a filter icon in both the Notebook view and App builder, but this icon will not be visible in the published App.
As of April 2023, any new SQL cells that use filters will accurately return the filtered dataframe. SQL cells that use filters, and were created prior to this date will continue to return unfiltered dataframes until action is taken by an Editor. Editors can click on the gear icon next to the returned dataframe in order and opt-in to returning the filtered dataframe.
Filter types
Each filter condition applies to an individual column.
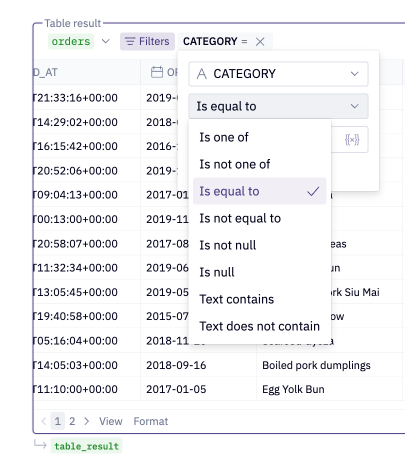
Multiple filter conditions can be combined in the same filter.
Depending on the column's data type, a different set of filter conditions can be applied:
- All data types: Is equal to, Is not equal to, Always
- Text: Text contains, Text does not contain
- Number: Greater than, Greater than or equal to, Less than, Less than or equal to
- Date: Day is, Day is before, Day is after
- Boolean: Is false, Is true
Jinja support
Table Display filters also support using Jinja
Note that only Jinja variables (i.e. values inside {{ }} brackets) are supported - Jinja expressions (with {% %}) are not supported.
Exporting dataframes
You can use Table Display cells to export a dataframe as a csv (comma separated values) file. Use the Download button in the bottom right corner of any Table Display cell to download a csv of the underlying dataframe.
This functionality is available in both the Notebook view and in published apps, so end users of apps can also download .csv's.
Conditional formatting and column formatting options will not be applied. The downloaded file will use the raw values from the underlying dataframe.