Single value cells
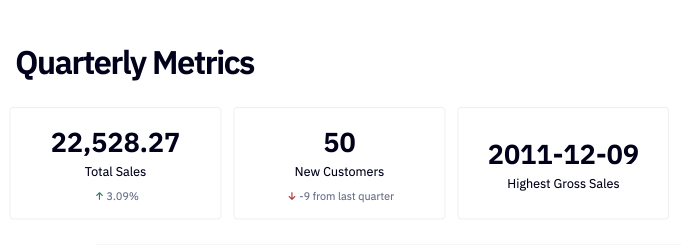
Call out the top-level results of your projects and contextualize them with comparisons to related data.
- Users will need Can Edit permissions.
With their larger font and distinct tile format, these cells are helpful for performing aggregations on your data and summarizing big takeaways of your data analysis.
Single value cell configuration
Single value cells can be created from the + Add cell bar, or from the Totals bar of a Table cell.
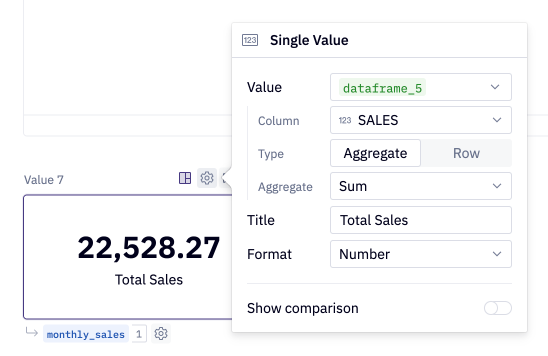
To configure a Single value cell, select the cog icon in the upper right of the cell. In the Value input, select the value you'd like to display. You can choose to display a value from a dataframe or a variable (single numeric or date).
If you select a dataframe, additional options will appear to configure the Column, Type, and Aggregation method, if applicable.
Single value cells will default to aggregating data, but you can configure the Type to represent a row index in a dataframe. Note that Python uses zero-based indexing, so the first row in your dataset will have a row number of 0.
Aggregate options
Single value cells support the following aggregate options: Sum, Avg, Min, Max, Median, Count, and Count distinct. Aggregate options to configure will depend on data type: Strings will display Count and Count distinct, and Dates will display Min, Max, Count, and Count distinct.
If you are missing Aggregate dropdown options, double check your data type!
Show comparison
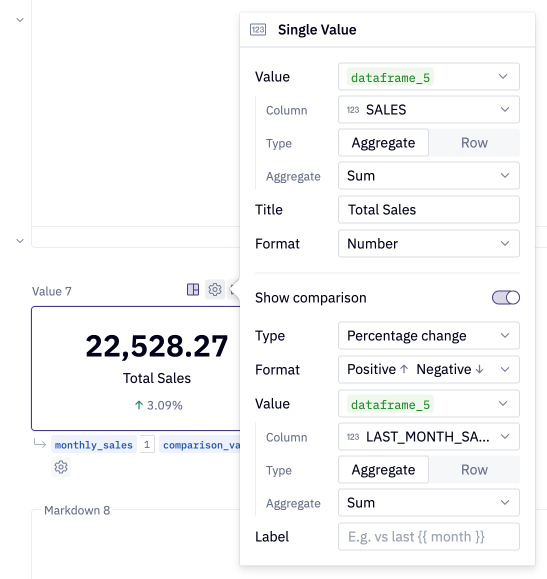
Compare the main value against another data point by toggling on the Show comparison option. Via the Type dropdown menu you can show a value comparison, an absolute change, or a percent change between the main value and the comparison value.
The Format dropdown will indicate whether an increase from the main value represents a positive change, or a negative change.
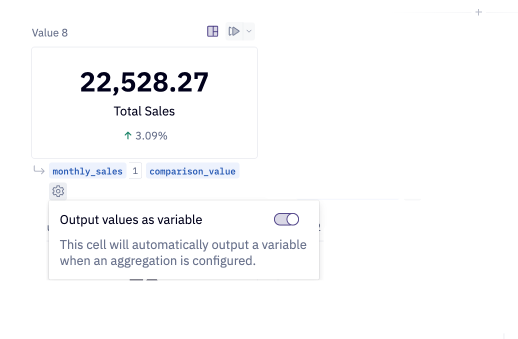
Output values as variable
Select the cog beneath your cell to output the single value (and comparison value, if configured) as a python variable. This will allow you to reference the values downstream in your project.