Welcome to our first release notes of spring — and it's a big one, with new features and improvements across almost every part of the product that broaden (or should I say widen?) what you can do with charts, published apps, Explore cells, and more.
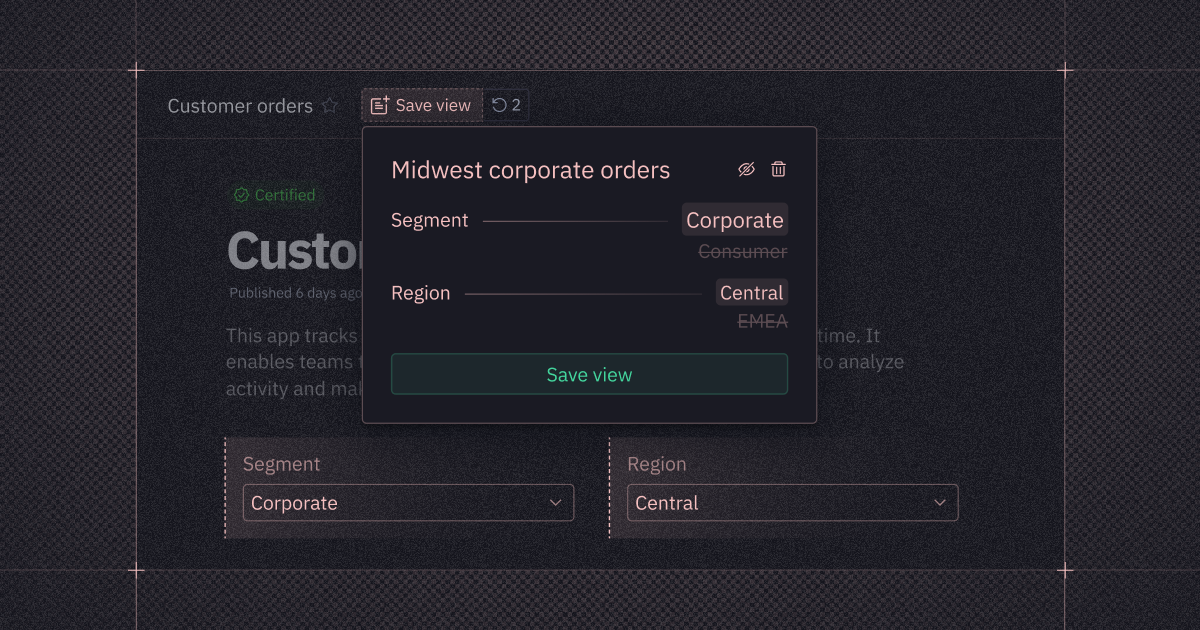
💾 Saved Views in published apps
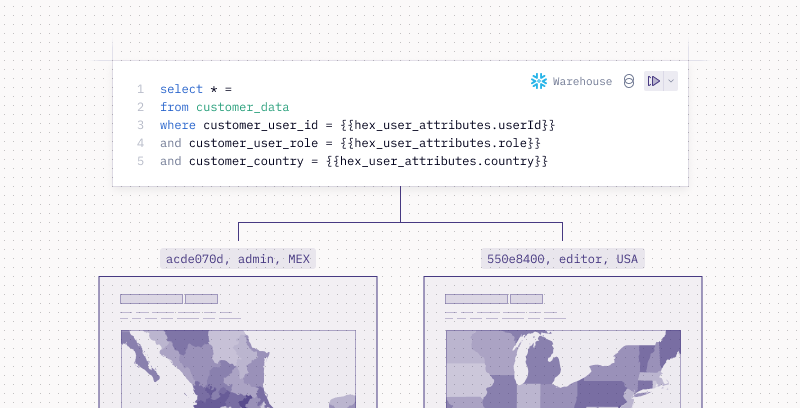
A single data app often serves a bunch of different audiences who care about different results. Introducing Saved Views: a way for users to save combinations of inputs and filters when viewing a published app, so they can get to insights that are relevant to them, faster.
On Team and Enterprise plans, you can create saved views, list them for others to use, and schedule them to re-run on a regular cadence for fresh data. Our team’s favorite new workflow? Get personalized conditional notifications based on a saved view.
Check out our blog post to learn more.
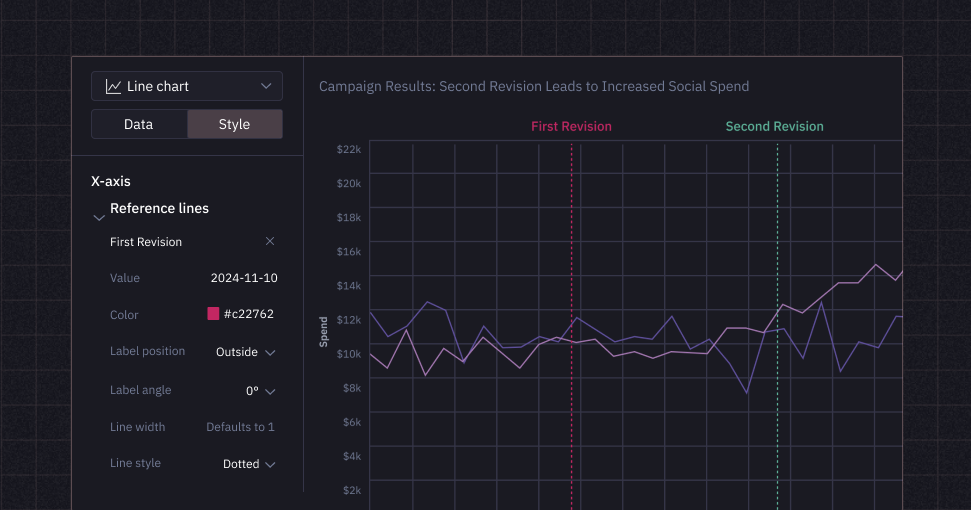
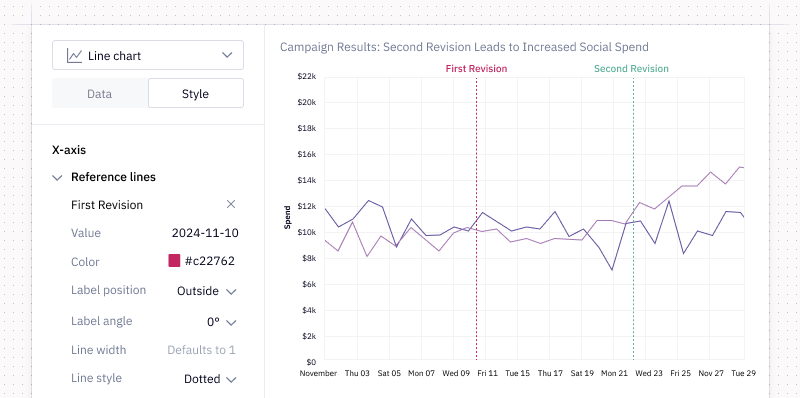
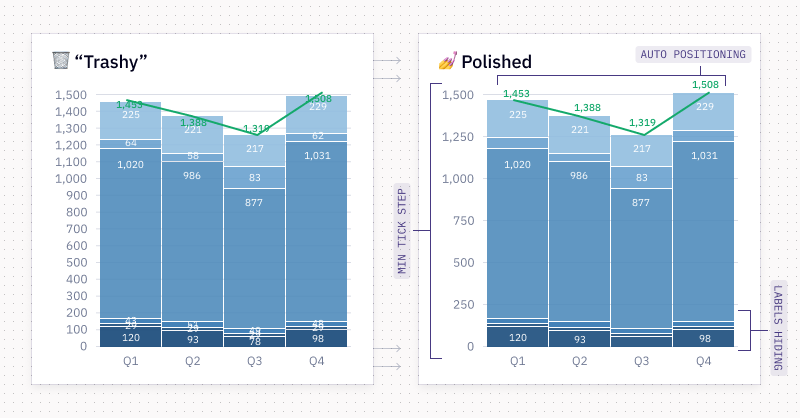
📊 Charts from wide-format data
Until today, you needed to write extra pre-processing in Python to make charts from wide-format data (i.e., spanning multiple columns of data). Now it only takes a click to:
- Create stacked or grouped bar and column charts from multiple columns
- Facet by multiple columns
- Plot multiple columns on the x-axis
In this new era of wide-format-friendly charts, the need to “tidy up” your data using the Pandas .melt() operation has effectively melted away. 😀
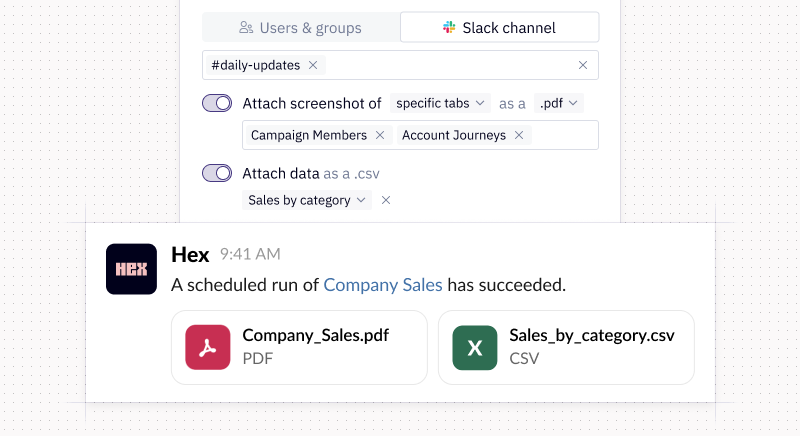
🔔 Notifications with CSVs & configurable screenshots
On Team and Enterprise plans, you now have two new notification options:
- Include a CSV attachment by selecting a table display in a published app.
- Send screenshot attachment of specific tabs or individual cells that triggered a conditional notification.
Mix and match CSVs with PDF or PNG screenshot attachments to send notifications to yourself and that VP who wants daily updates on new customer signups delivered straight to their inbox.
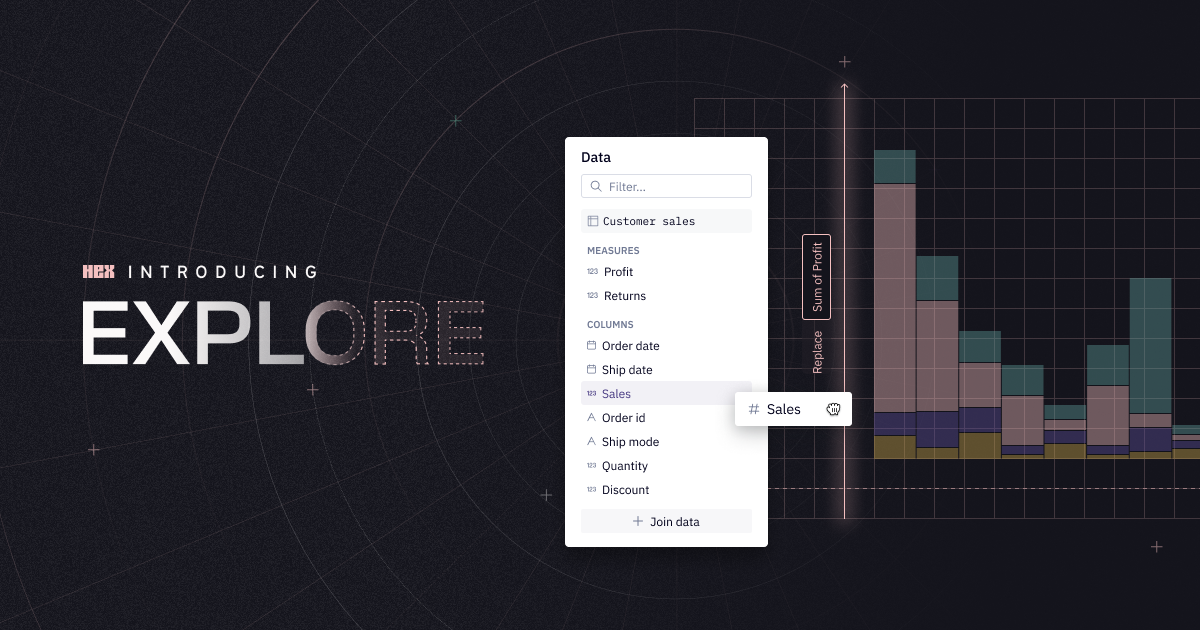
🧭 Use Explore cell results downstream
Hex makes it easy for code, no-code, and queries to live together in a canvas made of atomic building blocks that stack and engage with one another.
That’s why it's a rite of passage for every cell type to return a dataframe. Now that Explore cells do exactly that, you can truly integrate them into your notebook to unlock tremendous new workflows.
Got an exploration you want to dig further into? Just throw it into a notebook and start writing SQL or Python against the output of the Explore cell, or chain downstream no-code cells to your heart’s desire.
🧱 Bulk update components
Make one small tweak to a component, and suddenly every downstream reference is out of date! With great power comes great responsibility, and now you’ve got options depending on how authoritarian you’re feeling. 😈
Our new UI for managing a component’s project references provides useful metadata to help you understand how components are being used and which projects to prioritize updating.
If you're an Admin, this comes with the ability to force update all (or some) project drafts to use the latest version of a component.
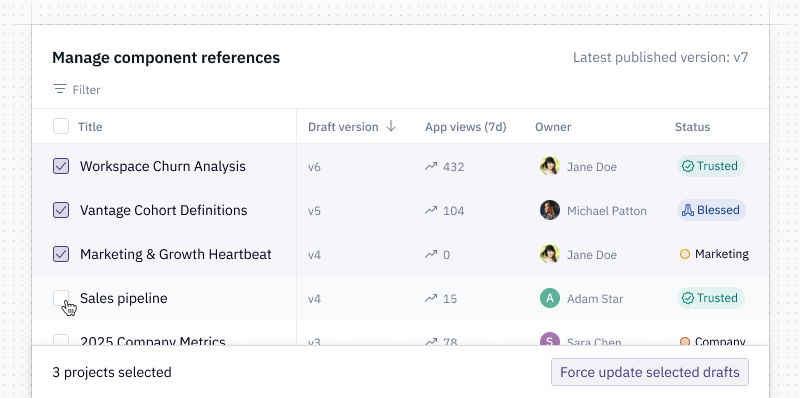
Feeling democratic? You can notify component consumers that a new version is available and let each project’s Editor decide whether to update.
We’ve seen customers try to wrangle components with hundreds of downstream references. Now, it can be as easy as a few clicks to keep components consistent across projects.
⌨️ Magic Typeahead
Write code faster with AI-powered inline completions in Python cells. Magic Typeahead is now out of beta and readier than ever to give you powerful, tailored suggestions that take into account your project context as you’re typing.
Other improvements
- View SQL generated by Explore: Hex generates SQL under the hood to power analysis performed with Explore. Instead of pulling up a separate tab with your data warehouse’s query history, you can now see the compiled queries directly in Hex by clicking the “View generated SQL” option in the Explore UI’s three-dot menu.
- Dropdown display labels: This feature we announced last time to enhance dropdown input parameters needed a bit more love — but it’s ready for use now. Thanks for your patience!