This week’s release is all about helping your team scale confidently in Hex. We’ve added new features to make Hex more intuitive and accessible for everyone in your org, and quality-of-life improvements to make it easier to govern, find, and use trusted data across your workspace.
👥 REST and Observability APIs for Admins
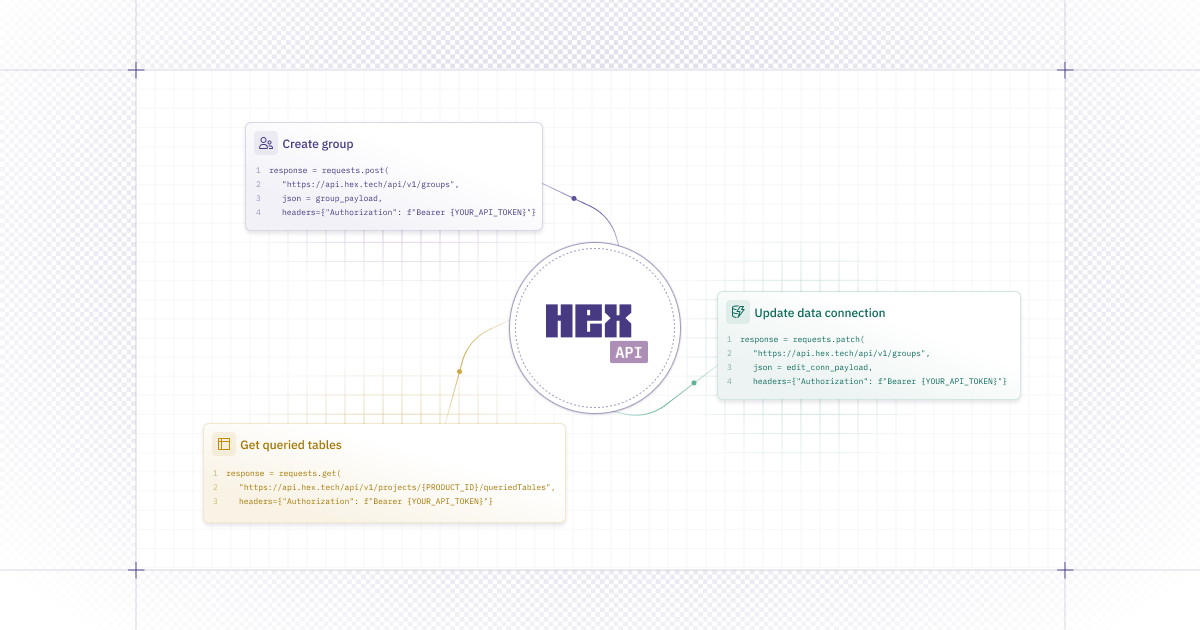
We recently announced new APIs for managing Hex workspaces at scale! Admins on Team and Enterprise plans can now use API endpoints to:
- Automate user role and group management
- Enforce consistent access policies across teams
- Plug Hex into your internal IT or data platform tooling

Plus, see which tables are queried across projects to better understand data access with a new Observability API now available on the Enterprise plan.
Read more about how you can get some time back by programmatically managing your workspace.
❓ Magic edits in Explore
Now in beta, Magic in Explore helps you iterate faster by editing explorations based on natural language prompts.
Ask Magic will only generate explorations based on endorsed data, for higher confidence in every output. This means you (the mighty steward of data 👑) can optimize Magic’s results by curating the universe your stakeholders explore.
If you’re excited about powering AI with semantic context, we’re starting to roll out early access to native semantic authoring in Hex. Drop us a note at [email protected] to join the alpha waitlist.
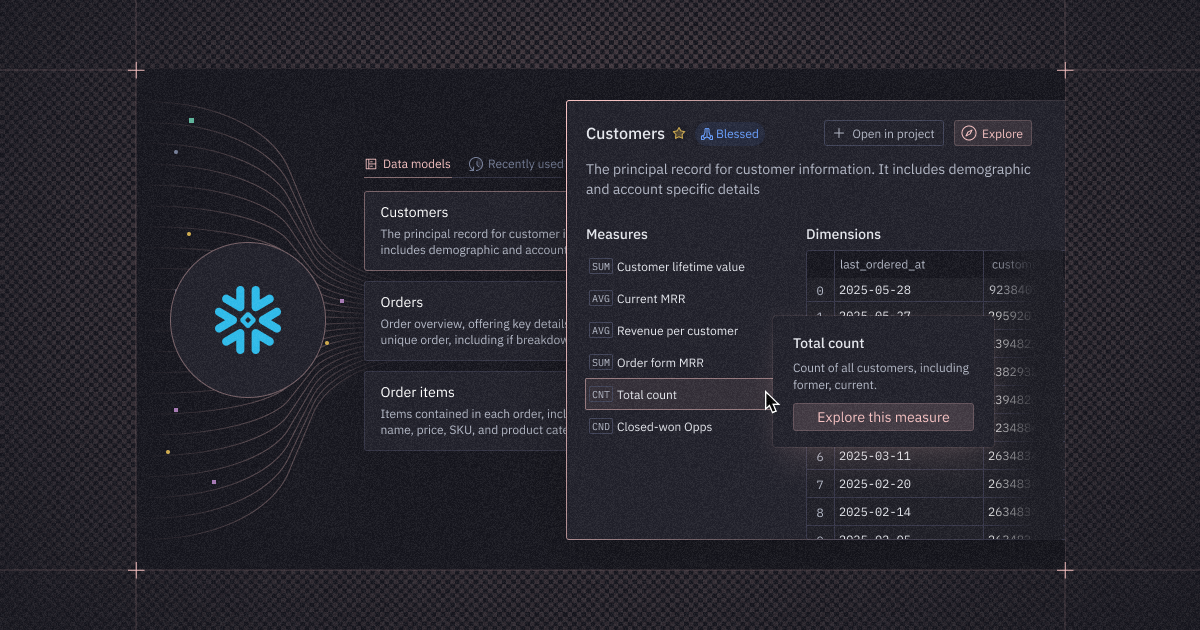
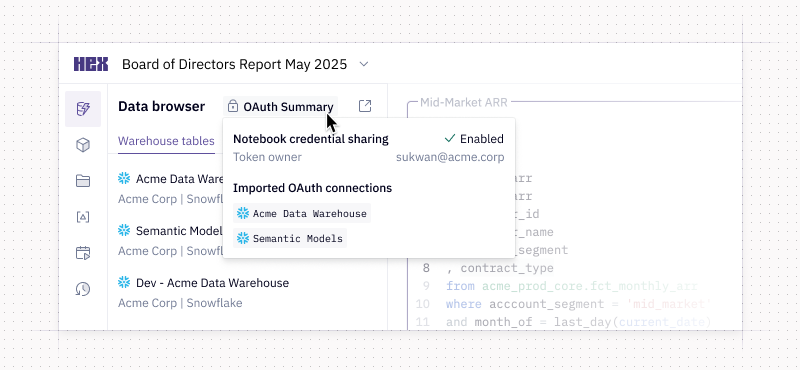
🏠 Recommended tab in the data browser
We rolled out a new recommended tab in the data browser that spotlights endorsed tables and models, making it easier to find trusted data — no guesswork required.
Admins can curate the data browser using endorsed statuses, so folks outside the data team can find their way with confidence.
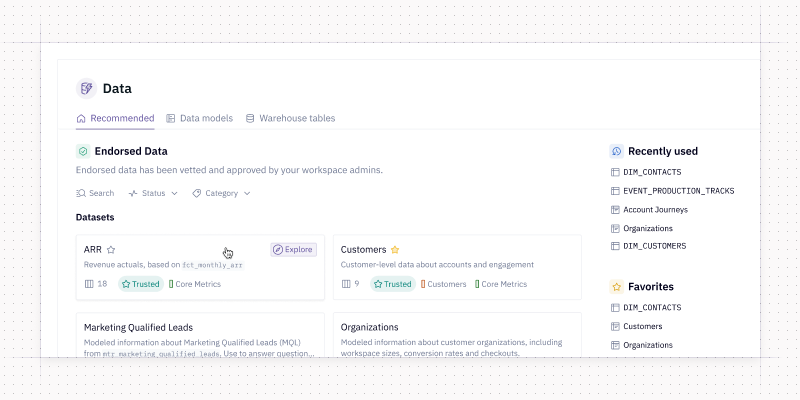
The new experience folds in recently used and favorites to keep things streamlined. And now, you can filter tables and models by status or category to zero in on exactly what you need.
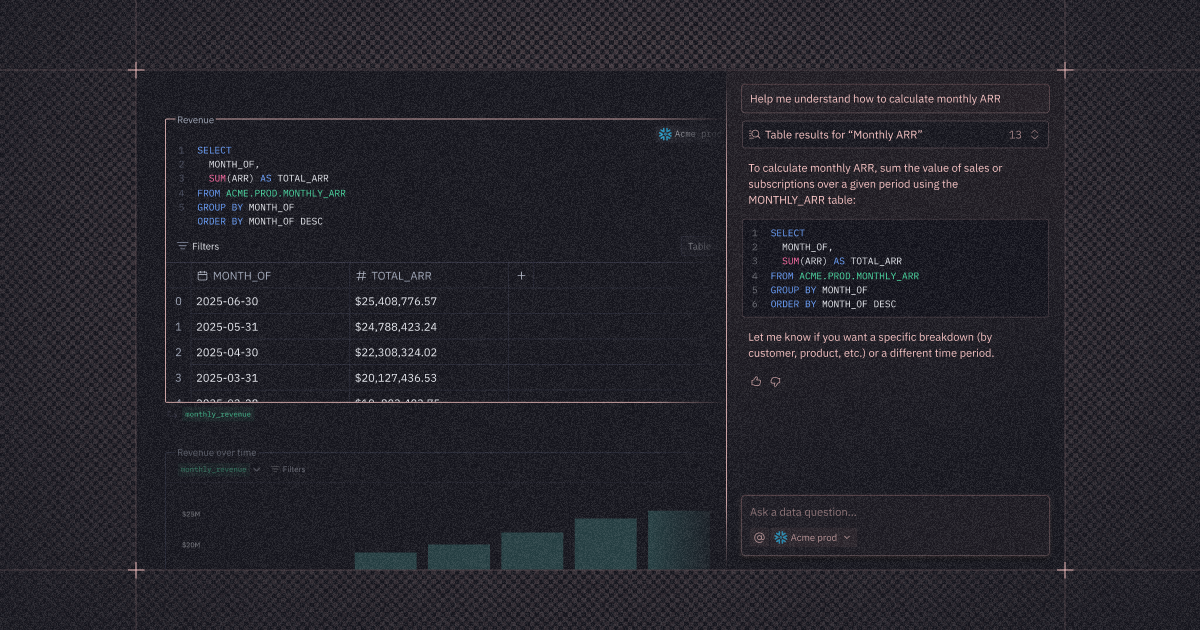
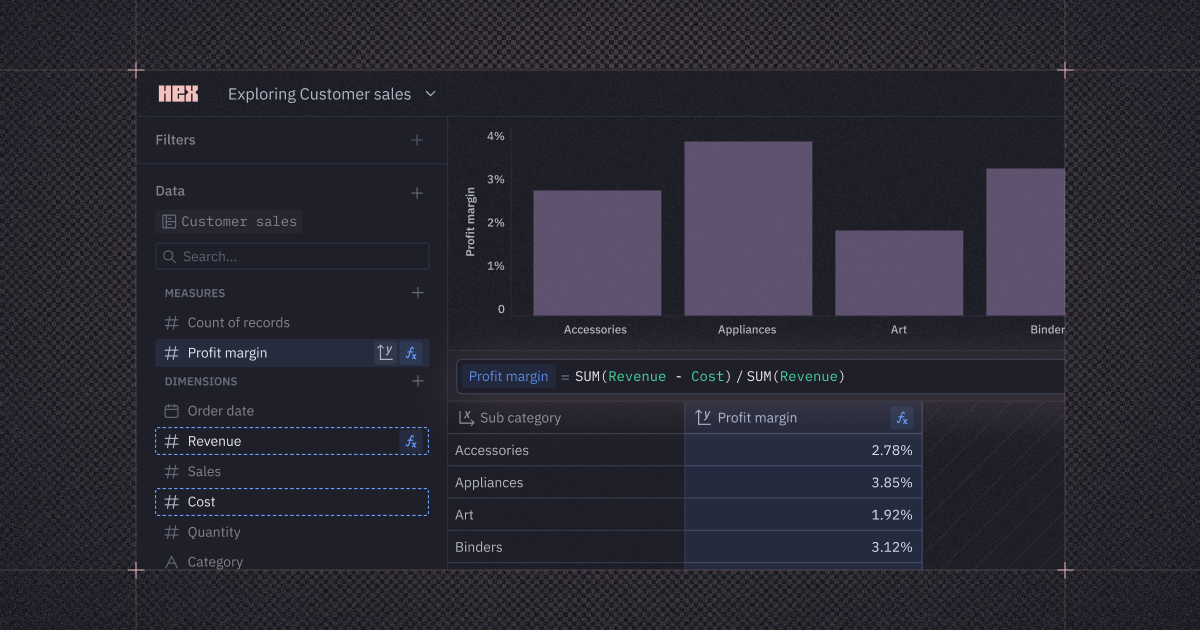
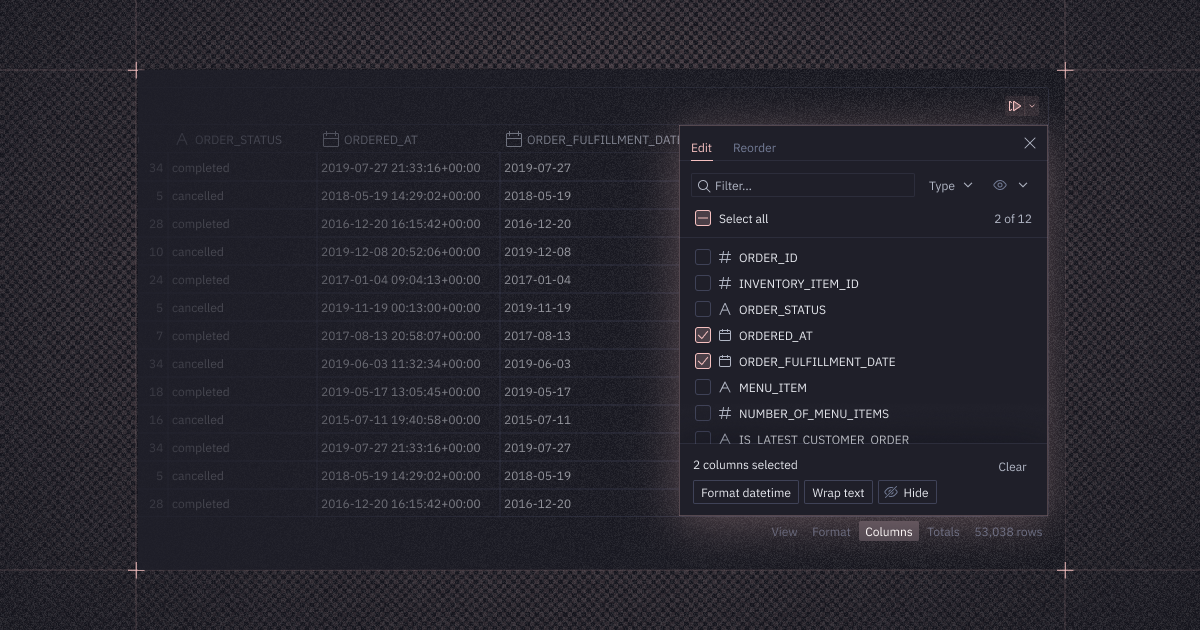
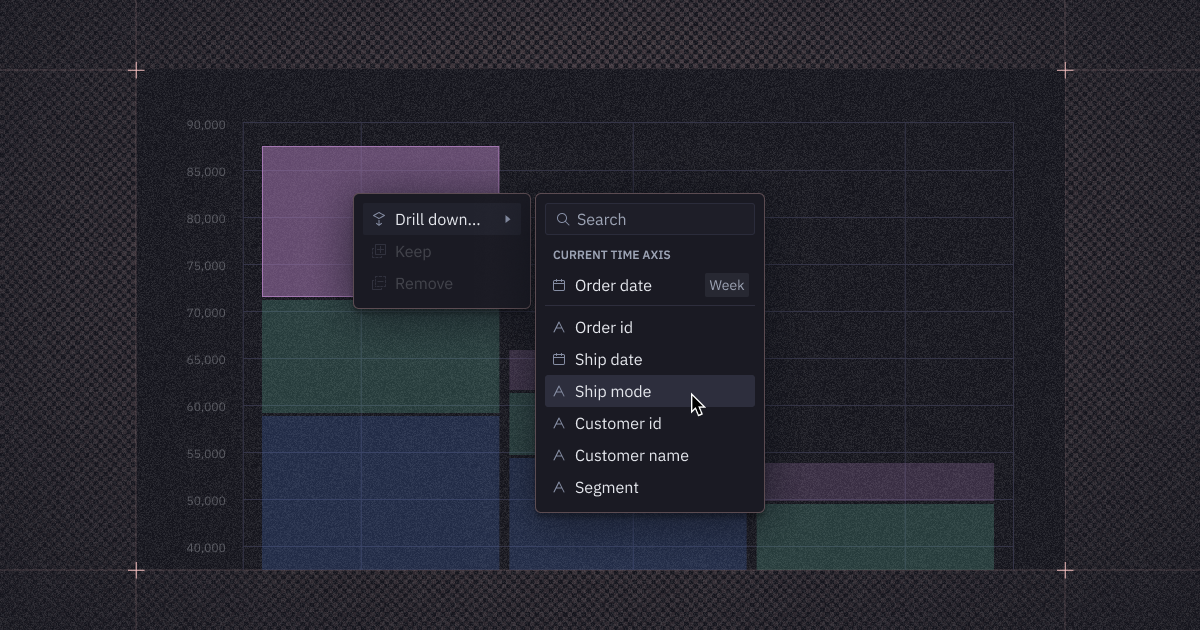
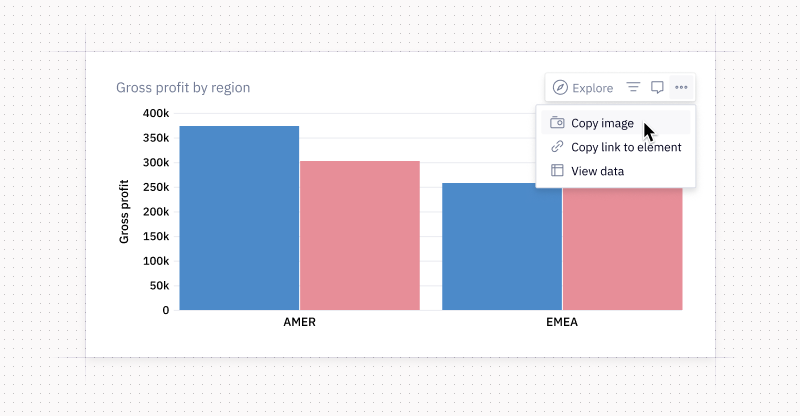
🔽 View underlying data in Explore
Want to see the customer seats that make up ARR without creating a new cell or switching views? You can now select portions of your Explore charts and pivots to quickly see the underlying data.
You can also expand or collapse individual aggregate rows to get a deeper look at what makes up an aggregate. This makes it easier to inspect row-level data, all within the table in your exploration.
Other improvements
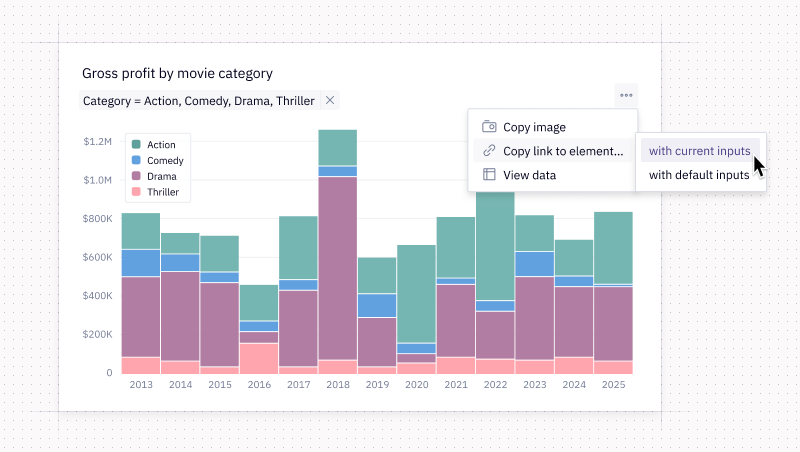
- Titles in URLs: Hex URLs got a little nicer! URLs now contain the title of the project in the URL and have a compressed Hex ID to make links slightly shorter. Don’t worry, you can still grab your project’s ID in several ways.
- Richer audit logs: Admins can now monitor CSV exports and PDF downloads through detailed audit log entries, supporting data governance and compliance requirements.
- Chart sorting improvements: Full color and facet sorting in charts are here! You can sort categorical "color by" by y-axis for all chart types and sort facets by y-axis and custom.
- Security & Privacy contacts for your workspace: Admins can now set Security & Privacy contacts in workspace settings to keep the right folks in the loop. These contacts will be notified in the rare event of a security issue (heaven forbid) or if we make updates to our subprocessors.