🗄️ Hex is now in Codex
At Hex, we want you to be able to analyze data from wherever you do your job. And we’re working hard on building our leading analytics agents and our unique approach to context into the places our customers are working.
Starting today, you can bring Hex directly into Codex to run analyses, pull in existing work, and spin up new projects.
💪 What you can do
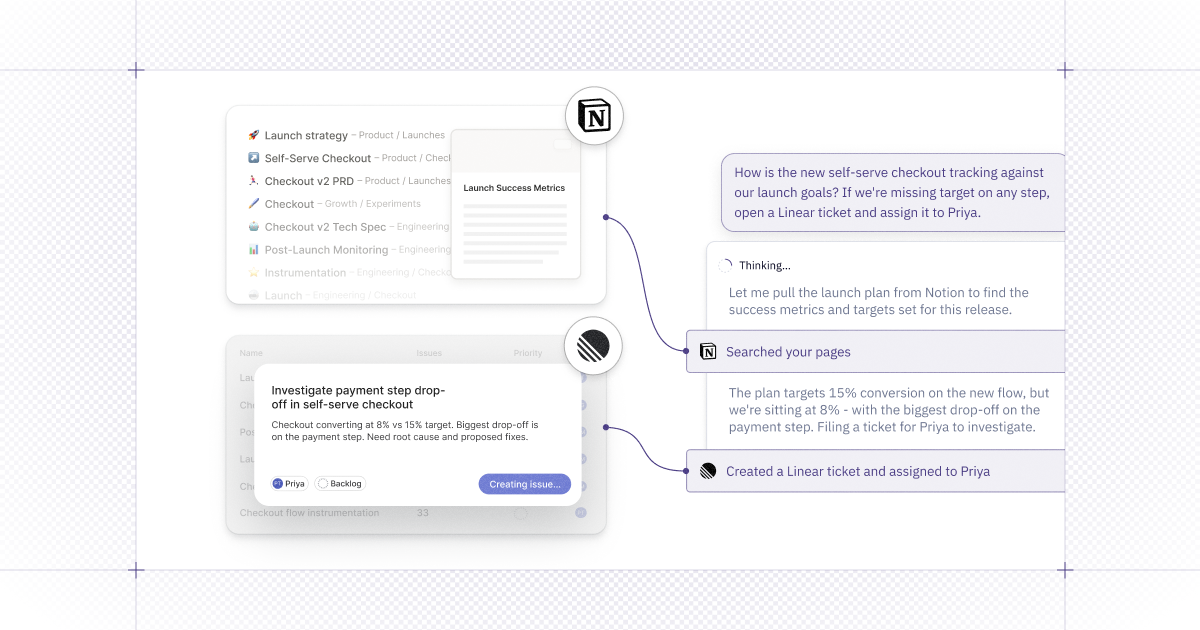
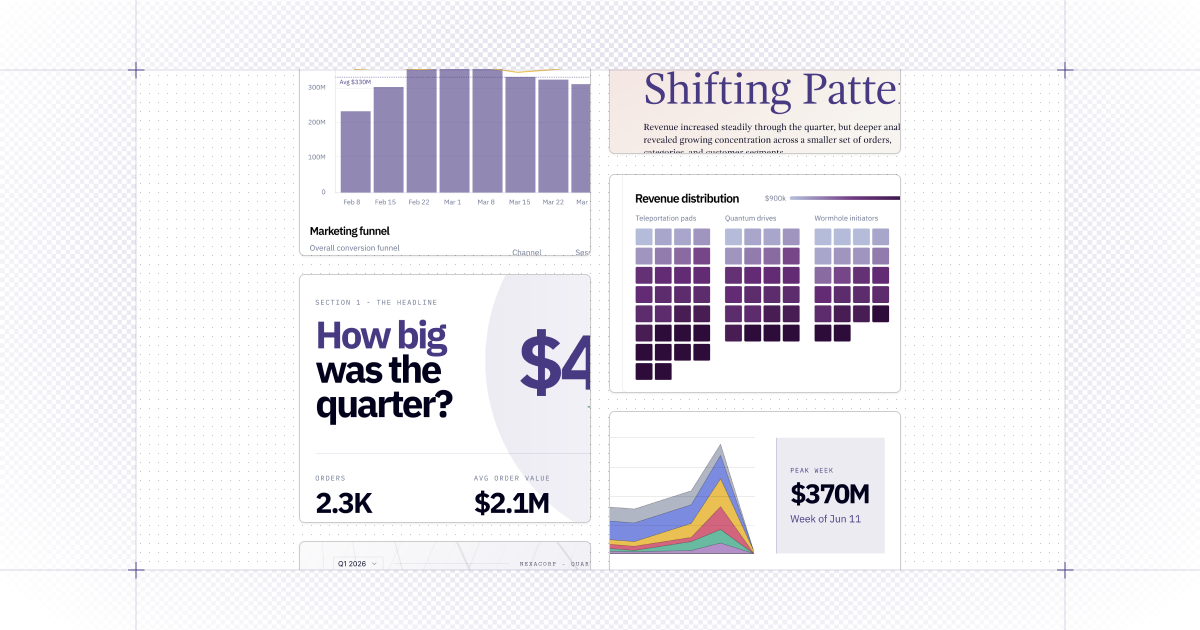
- Kick off Hex analysis from Codex - Need to understand churn by segment? Dig into pipeline performance? Codex can invoke Hex to pull the data, run analysis, and return results without switching tabs.
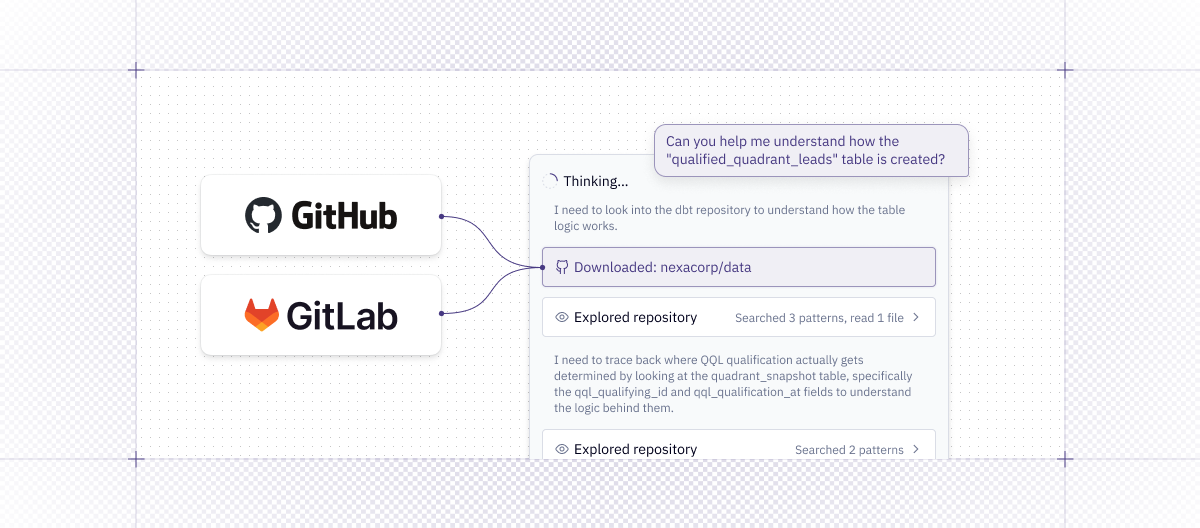
- Pull Hex Threads into Codex - If you've already done analytical work in Hex, you can pull in your prior Hex work to incorporate data into whatever you build.
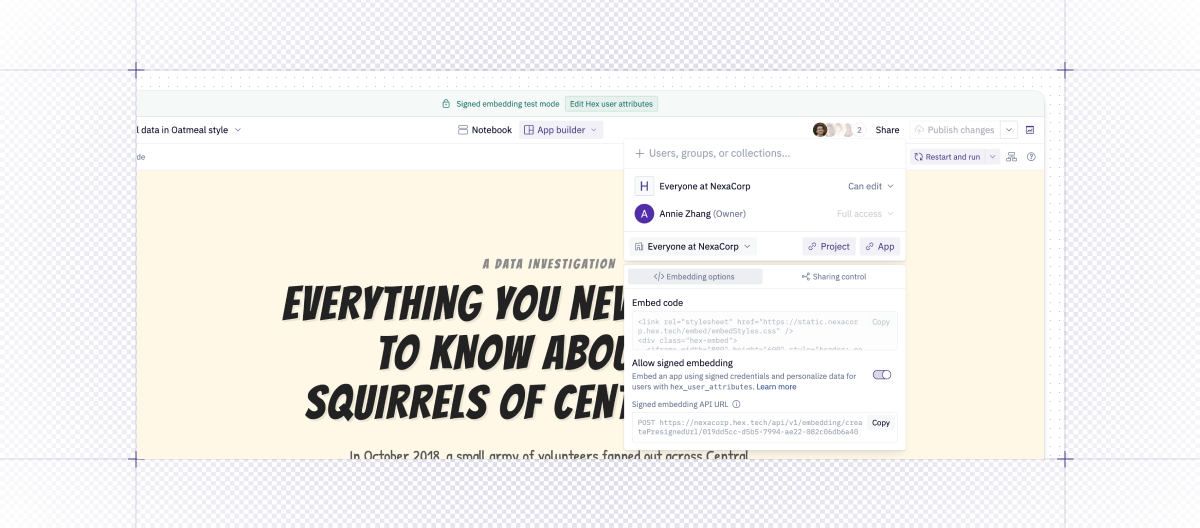
- Control Hex programmatically using the CLI - For more specific, structured tasks - such as creating projects, adding cells, or configuring analysis - you can leverage the CLI connection in Codex for a more precise interface into Hex.
To use Hex in Codex, head to Plugins and install the Data Analytics plugin. Then connect to Hex and you're ready to go!