Run stats
Understand the performance of your project with run stats
Run stats help users with Can Edit permission understand a project's performance by showing cell timings and cache usage.
Navigate run stats
Notebooks
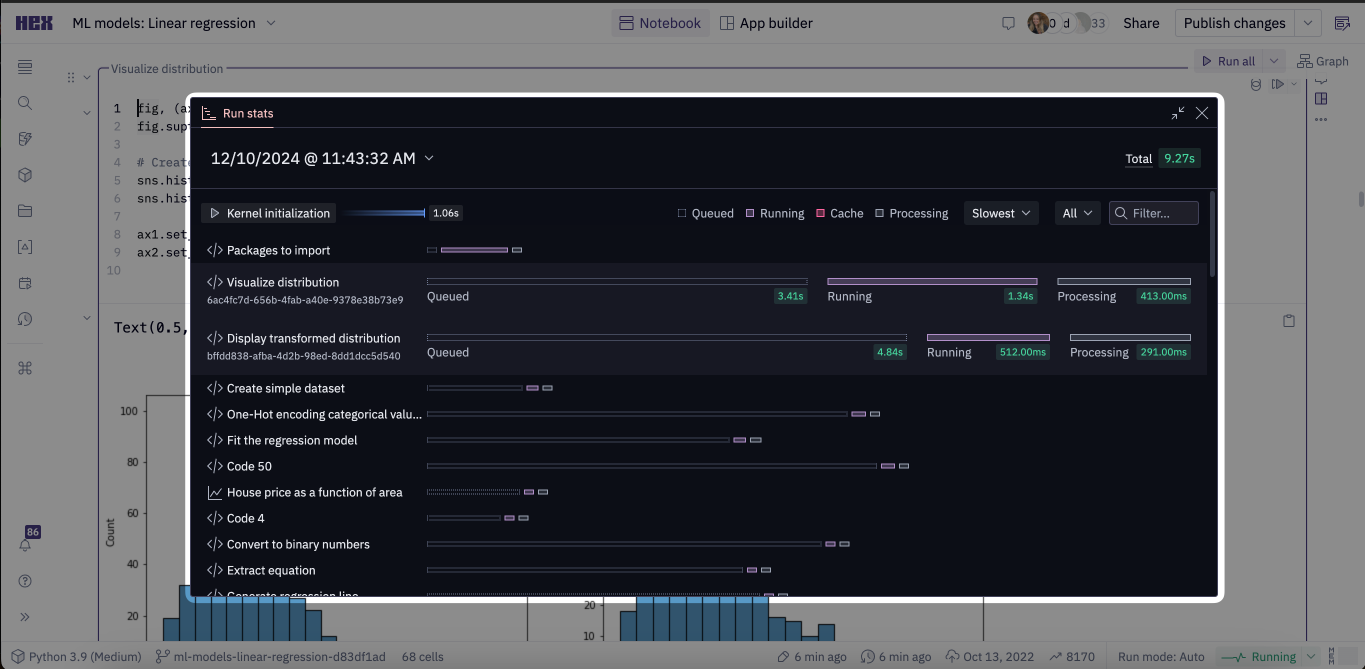
Access run stats via the Run button dropdown in the upper right corner of your project.
By default, stats from the most recent run will be shown. Select the timestamp of your run from the date time dropdown in the upper left corner of the run stats modal.
You'll see any notebook runs (not app runs) up to two days old. Every run of the entire notebook, a selection of cells, or a singular cell, will produce a new profile labeled with the date and time. If you see No runs found upon opening the run stats, no runs of the notebook happened in the last two days. Run your notebook to see stats on project and cell runs.
Published apps
From the top-right three-dot menu, select "Advanced" -> "Enter debug mode". Then, from the question mark in the bottom-left, select "View run stats."
By default, stats from the most recent run will be shown. You can also select other runs from the current app session — at present, it's not possible to access runs from other app sessions.
Run level stats
The top of the run stats provides some overall information about the run, as well as the legend used for interpreting the per cell information that follows. Here you'll see the total run time, the total time spent reading from (and writing to) cache, as well as kernel initialization time.
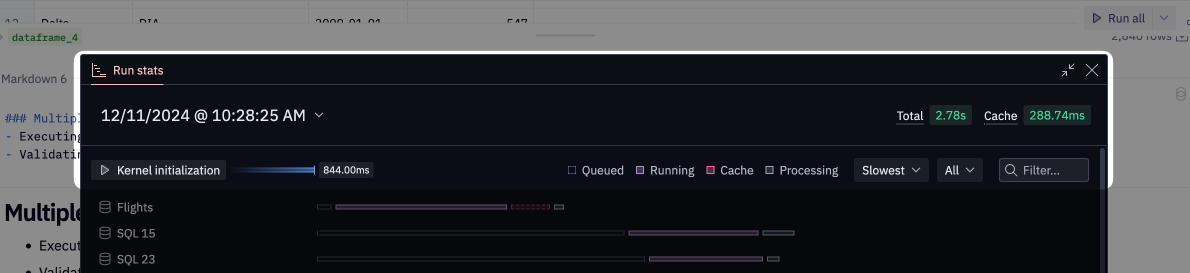
- Total: The total time spent executing the selected run.
- Cache: The total time spent reading from and writing to Hex's SQL cache.
- Kernel initialization: The time spent initializing your kernel to run the cells in your project. This is impacted by time spent loading files and imported GitHub packages
In the top right of the modal, you can filter by type of cell, searching cell name or sorting by slowest to fastest, fastest to slowest, or execution order of cells.
Cell level stats
Click into an individual cell to view the time spent queueing, running, processing and reading to and writing from cache.
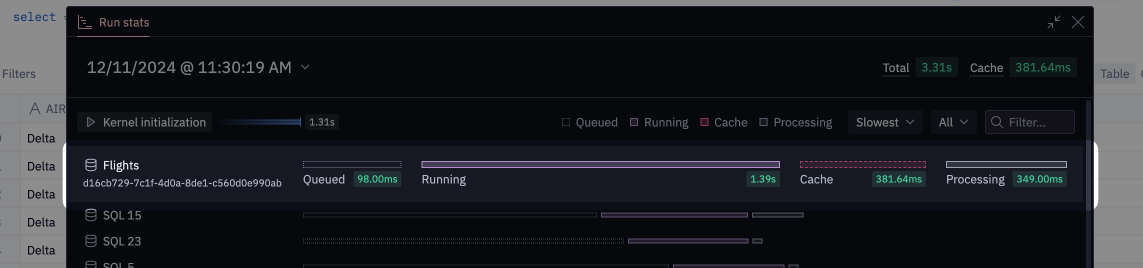
The legend explains the time spent:
- Queued: The time spent waiting in the ‘queue’ to execute. Typically this is time spent waiting for upstream cells.
- Running: The time spent running a cell. Notice that cells run during the ‘queue’ time of other cells.
- Processing: The time spent processing the cell’s query or command output within Hex before displaying the output.
- Cache: The time spent reading from and writing to Hex’s cache.