Agent Observability
Understand how Agents are being used across your workspace.
- Available on the Team and Enterprise plans.
- Users need the Admin or Manager role to access the observability dashboard.
- Only Admins can view individual conversations.
The Context Studio includes built-in observability tools that help you understand how agents are being used and how well they are performing. Instead of relying on anecdotal feedback, the Context Studio surfaces patterns across conversations so you can focus your efforts where they will have the most impact.
Dashboard
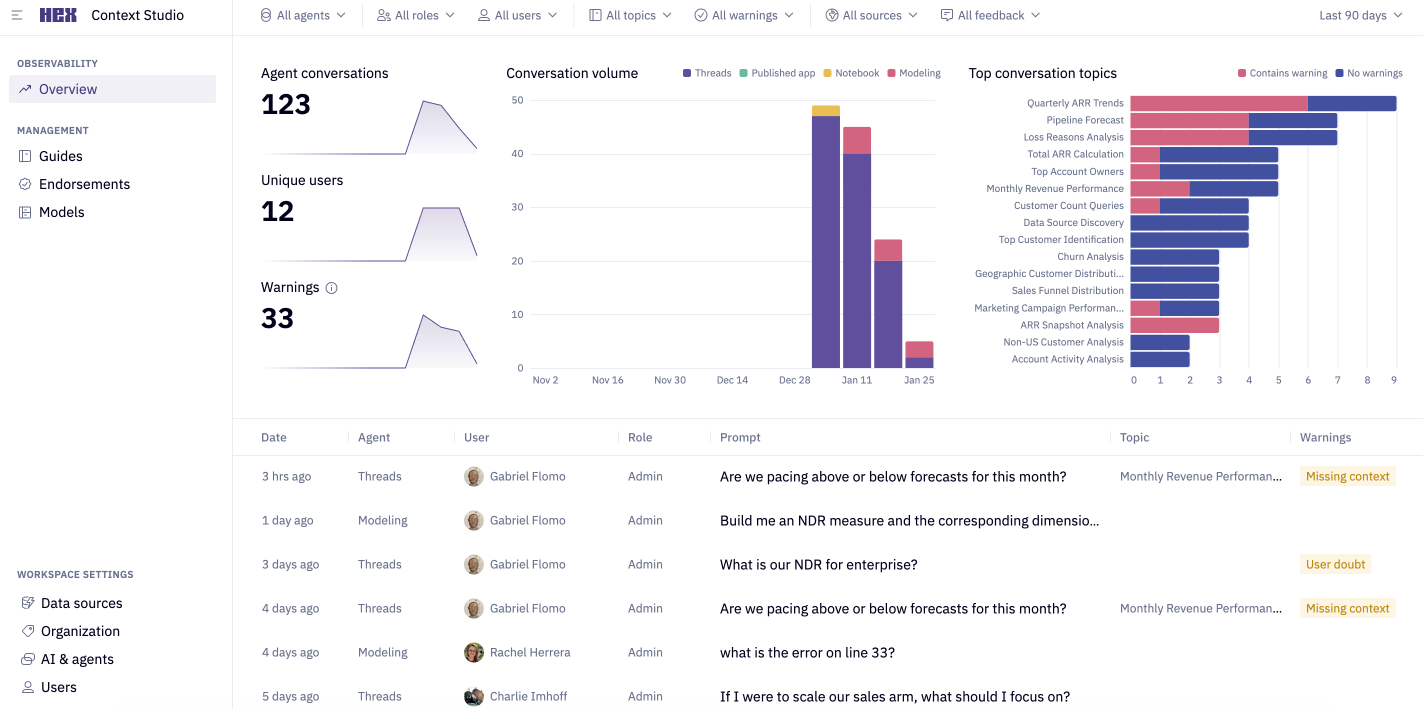
The Dashboard provides a high-level view of agent usage across your workspace. It is the starting point for identifying trends, recurring questions, and areas where agents may need additional context.
From the Dashboard, you can:
- Track conversation volume over time
- See common topics across agent conversations
- Review patterns in warnings and user feedback
- Filter conversations to narrow in on specific areas of interest
Contents of Sensitive Threads are hidden in the Context Studio — Admins can see that the thread exists, along with the creator and timestamp, but not the messages themselves. Workspace admins can still access the full contents of Sensitive Threads if they have a direct link to the Thread.
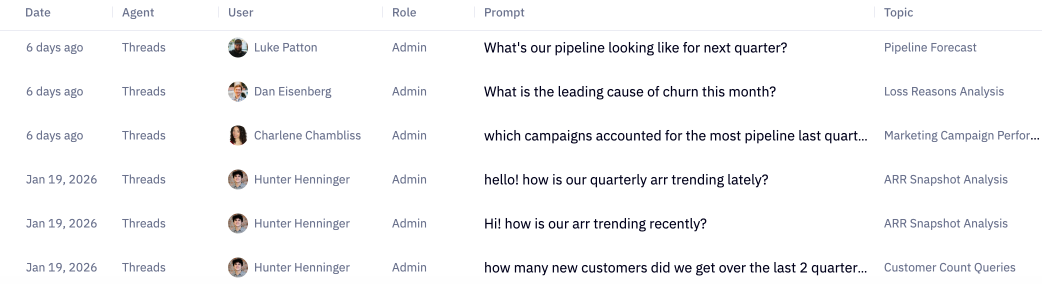
Filters
Use filters to narrow the Dashboard to specific conversations or usage patterns. You can filter by:
- Agent type (Threads, Notebook agent, Modeling agent, Published app agent)
- Workspace role
- Individual users
- Source location (Hex, Slack, or MCP)
- Topics
- Warnings
- Time range (7, 30, or 90 days)
Managers can view aggregated metrics and trends. Admins can also open individual conversations for deeper inspection.
Topics
Topics group agent conversations into meaningful categories based on shared patterns. They help you understand what kinds of questions users are asking across your workspace and which areas come up most often.
Topics are generated automatically and may not appear for every conversation. In some cases, a topic may be assigned after a conversation becomes inactive.
Thread Inspector
The Thread Inspector is a read-only view that allows Admins to review a specific agent conversation in detail. It helps explain what happened in the conversation, how the agent responded, and where additional context may be needed.
You can use the Thread Inspector to follow up on patterns surfaced in the Dashboard, including Topics, Warnings, and user feedback.
The Thread Inspector includes three sections:
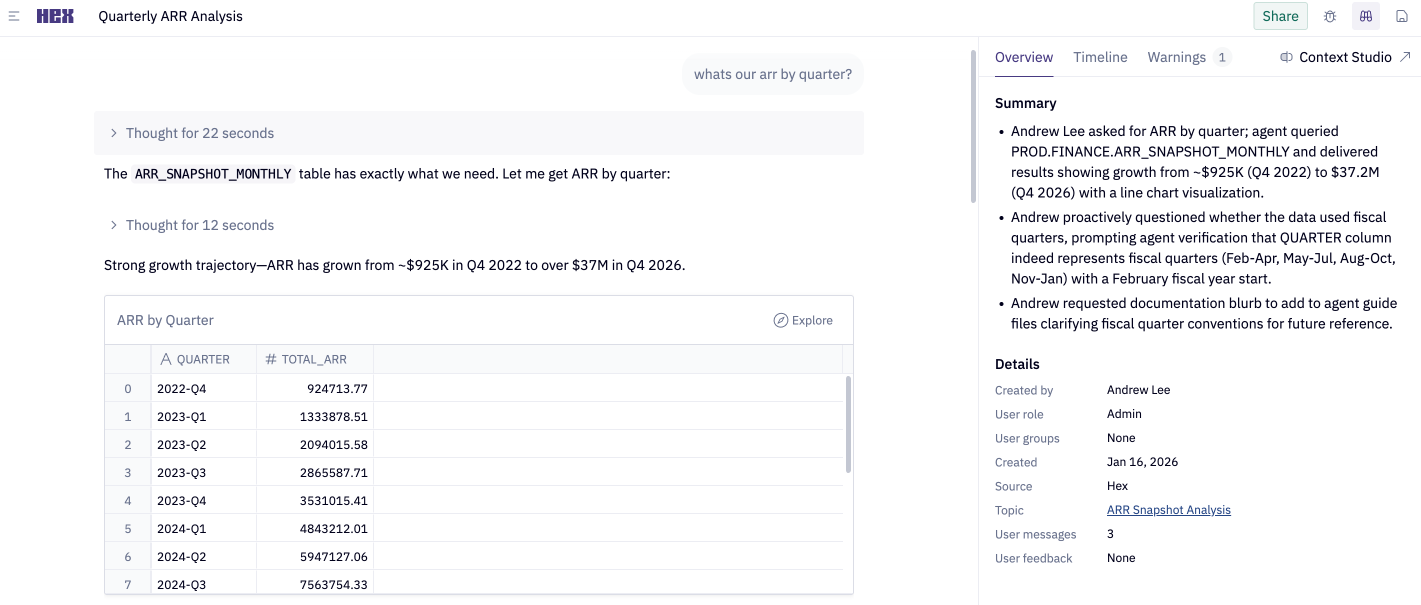
Overview
The Overview provides a high-level summary of the conversation, including who asked the question, when the conversation occurred, and a synopsis of the user’s questions and the agent’s responses.
Timeline
The Timeline shows how the conversation unfolded step by step, including the sequence of messages and the tools the agent used.
This view lets you review individual turns in the conversation, inspect tool calls made by the agent, and see the primary data assets referenced at each stage. It helps explain how the agent arrived at its response.
You can click into individual tool calls to jump to where they occurred in the conversation.
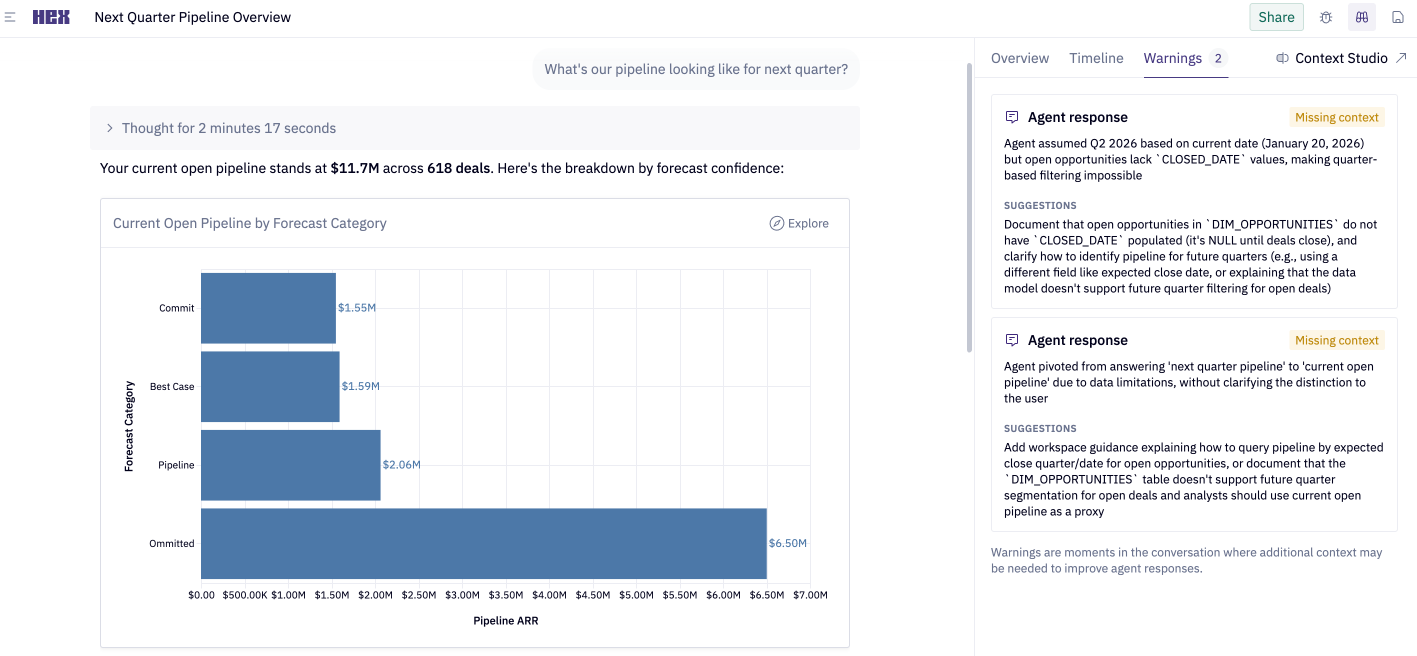
Warnings
The Warnings tab highlights moments where the agent may have lacked context during the conversation. These warnings help you identify specific issues in an individual thread and spot recurring patterns across your workspace.
Warnings are categorized into several types:
| Warning type | What it means |
|---|---|
| Missing context | The agent needed information that is not documented in your workspace, such as a metric definition, a table relationship, or a business rule |
| User doubt | The user expressed skepticism or pushed back on the agent’s answer, suggesting the response may have been incorrect or incomplete |
| Data limitation | The agent flagged a caveat about the data it used, such as incomplete coverage, a known gap, or an assumption it had to make |
Warnings are important signals for improving workspace context. In a single conversation, they can highlight where an agent struggled. Across many conversations, repeated warnings help reveal broader gaps in your documentation, metadata, or endorsed resources.
Each warning includes suggested context updates to help improve future agent responses. Repeated warning patterns can also contribute to Suggestions, which groups recurring issues into concrete changes you can review and apply.
Export
Data from the Observability Dashboard and Thread Inspector can be exported programmatically via the API or CLI.
| Interface | Key References |
|---|---|
| API | GetThread, ListThreads, GetThreadMessages, ListTopics |
| CLI | hex thread get <thread_id>, hex thread list, hex thread messages, hex context topic list |
Workspace Admins can access every non-Sensitive Thread — Threads marked Sensitive are returned with their title redacted. Managers receive Threads they created plus Threads that have been shared with them.
Credit consumption data is available in the Context Studio, providing insight for context curation guidance. Note that this is not a billing source of truth — the Settings > Billing and credits page should be used as the authoritative source for credit consumption. Differences between credit usage information in the Context Studio vs Billing and credits settings include:
- Date fields in the Context Studio are based on Thread creation date. Credits consumed by messages added later are reflected under the original Thread-creation date in Context Studio, but may appear in a later billing cycle in Billing and credits
- Deleted Threads do not appear in the Context Studio. Thus, Context Studio credit totals may be missing deleted Thread consumption that is accounted for in Billing and credits
Next steps
Use what you learn from agent conversations to review and refine the context that shapes future responses.
- Suggestions: Review recurring issues and proposed improvements