Workspace color palettes
Customize your Hex apps with specific color palettes.
- Available on the Team and Enterprise plans.
- Users will need the Admin role to configure custom color palettes.
Adding a color palette
Admins can add a custom color palette that, when set as the active palette, will be used as the categorical color palette in Chart cells. Head to Settings, then Styling, and add your custom color palette under the Color palette subheading.
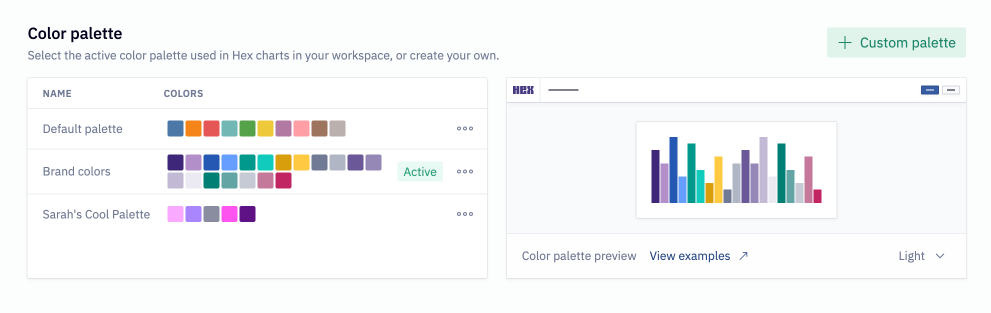
To add a new color palette, use the Add custom palette button. Alternatively, use the three-dot menu to duplicate an existing palette.
To edit a color palette, use the three-dot menu and select Edit.
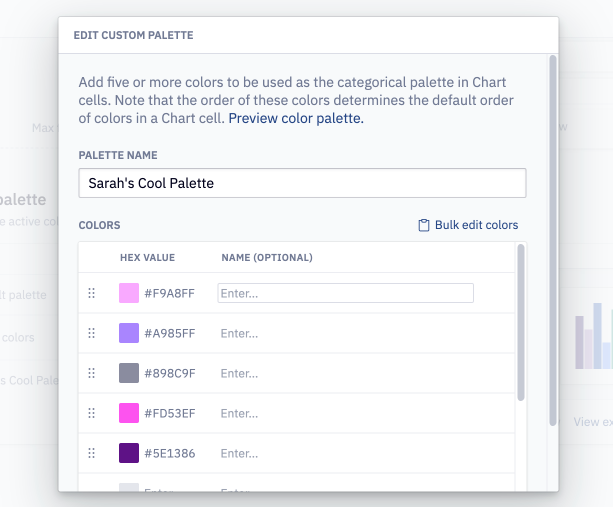
Color values can be formatted as hex strings, such as #F5C0C0 or AD8EB6, or as CSS color names, such as mediumpurple. You can also click on the color swatch to open and select a shade from the color picker. It's also possible to enter bulk color values: use a comma between each color name to separate them. To remove a color from a palette, click on the trash icon. Colors can optionally be given names to make them easier to identify.
These changes will be reflected the next time a chart is run — any apps with a cached default state will need to have their cache refreshed for these changes to take effect.
Changing the active color palette
Only one color palette can be active at a time. To change the active color palette, use the three-dot menu and set the select Set active.
Which charts will be updated when I change the active color palette?
Updating the active color palette will update any existing Chart cells. Note that changing the active color palette will not impact:
- Chart cells built with the legacy chart builder (deprecated as of Dec 2022)
- Chart cells where colors have been manually customized by the user
When will my charts be updated when I set a new active color palette?
These changes will be reflected the next time a chart is run — any apps with a cached default state will need to have their cache refreshed for these changes to take effect.
Using the active color palette in code
The hex_color_palette built-in variable represents the currently active color palette as an array of CSS color names, for example:
>>> print(hex_color_palette)

['#4C78A8', '#F58518', '#E45756', '#72B7B2', '#54A24B', '#EECA3B', '#B279A2', '#FF9DA6', '#9D755D', '#BAB0AC']
Using this variable can help create consistently themed visualizations when using both the native Chart cell and visualizations created via Python packages. For example, this Plotly chart will use the same color palette as your workspace:
import plotly.express as px

df = px.data.gapminder()
fig = px.line(
    df,
    y="lifeExp",
    x="year",
    color="continent",
    line_group="country",
    line_shape="spline",
    render_mode="svg",
    color_discrete_sequence=hex_color_palette,
)

fig.show()