Project filters
Project filters make it easy to apply a filter to multiple cells, spanning multiple dataframes. They can be used in both the Notebook and the published app.
- Users will need Can Edit or higher project permissions to create project filters.
- Users with Can View App or higher project permissions can apply project filters to other matching elements.
Add project filters from the app builder
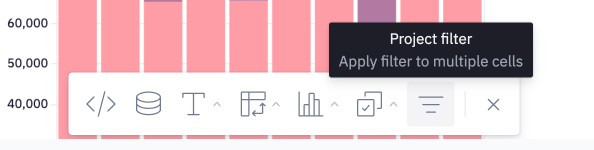
From the app builder, click the Project filter option from the Add cells toolbar.
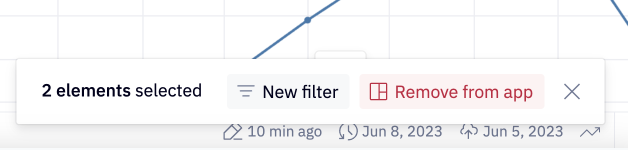
Alternatively, select multiple cells and click the pop-up for New filter.
Add project filters from the Notebook
To add a project filter from the Notebook, select + Add project filter at the top of the project.

Configure project filters
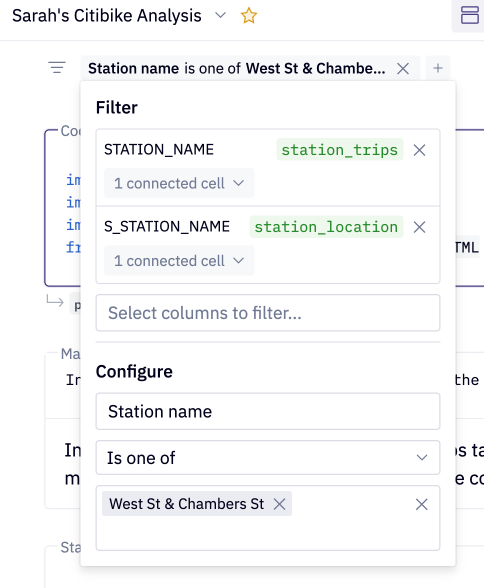
A project filter can be applied to multiple columns from distinct dataframes. In the project filter modal, click Select columns to filter… to choose the columns you want the filter to be applied to.
If the filter is created by selecting multiple cells in the app builder, columns represented in these cells will be suggested by default.
After columns have been selected, preview which cells are linked to each column by clicking the X connected cells dropdown. Use the dropdown to control exactly which cells are impacted by the filter.
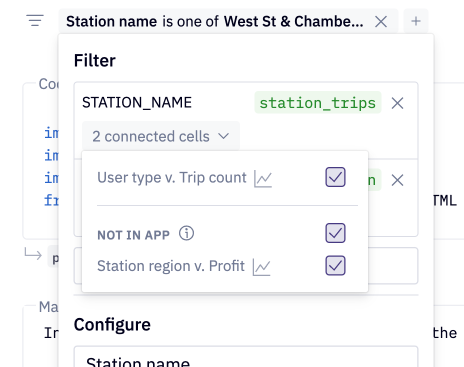
If the filter is created in the app builder, the filter will only apply to cells that are included in the app by default; this can be adjusted if desired.
After the project filter is created, filter indicators will appear on the cells impacted by the filter.
Use project filters in the published app
If a project is published with project filters, they will be visible in the published app, and app users will be able to interact with them.
If an app user interacts with a chart to filter data, they will have the option to apply the filter to other matching elements, creating a new project filter.
- When filtering on a categorical variable, any chart that uses the same dataframe will be defined as a matching element
- When filtering on a time series, any chart that also uses a time series as an axis will be defined as a matching element
This provides app users with the ability to easily cross-filter subsets of cells.